
|
Fig. 2
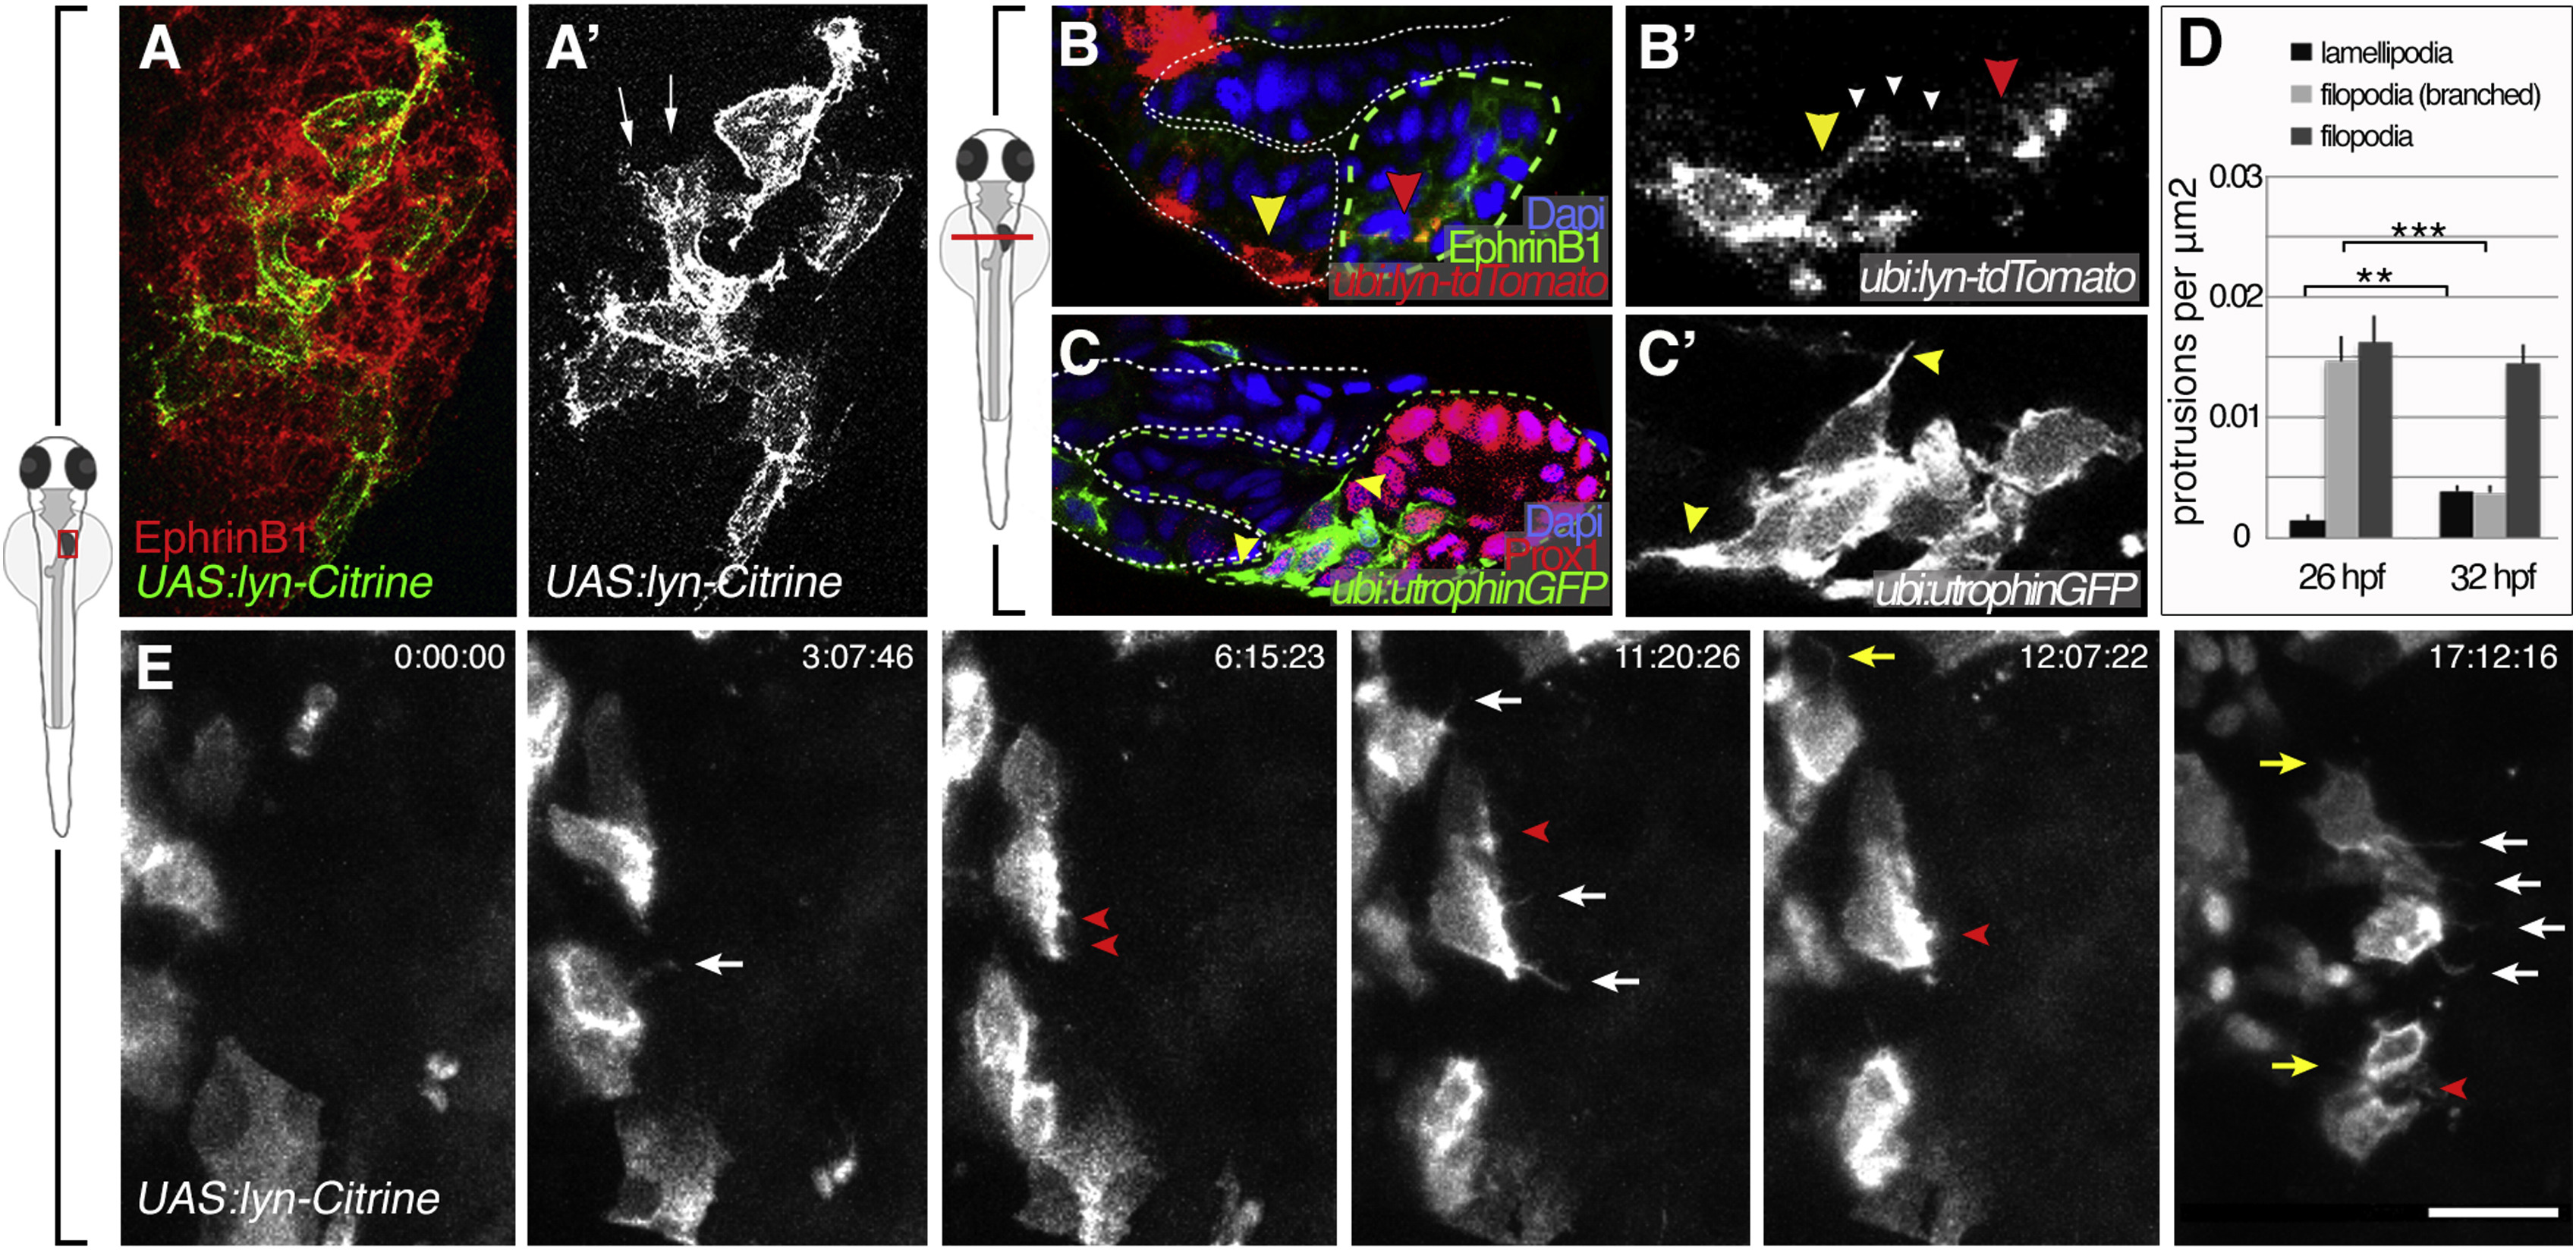
Hepatoblasts Form Filopodia- and Lamellipodia-like Protrusions during Liver Budding
(A-B′) Mosaic UAS:lyn-citrine or ubi:lyn-tdTomato expression shows EphrinB1+ hepatoblasts form lamellipodia (arrows in A′) and filopodia-like extensions (B and B′). Extensions (white arrowheads) connect the LPM (yellow arrowhead) and hepatoblasts (red arrowhead) over several cell diameters (B and B′). Dashed lines outline the LPM (white) and endoderm (green).
(C and C′) Utrophin-GFP highlights actin in the cortical network and protrusions of hepatoblasts (arrowheads). Dashed lines delineate endoderm (green) and LPM (white).
(D) Quantification of hepatoblast protrusions shows an increase of lamellipodia and decrease of filopodia-like extensions during budding.
(E) Time lapse of migrating hepatoblasts during liver budding and early outgrowth; dorsal views. Membrane labeling with UAS:lyn-Citrine shows filopodia in the direction of outgrowth (white arrows) and toward the LPM (yellow arrows) and lamellipodia (red arrowheads); stills of Movie S3. Scale bars represent 30 μm.
∗∗p < 0.01, ∗∗∗p < 0.001). See also Movie S3.
Reprinted from Developmental Cell, 39, Cayuso, J., Dzementsei, A., Fischer, J.C., Karemore, G., Caviglia, S., Bartholdson, J., Wright, G.J., Ober, E.A., EphrinB1/EphB3b Coordinate Bidirectional Epithelial-Mesenchymal Interactions Controlling Liver Morphogenesis and Laterality, 316-328, Copyright (2016) with permission from Elsevier. Full text @ Dev. Cell