
Image
|
Figure Caption
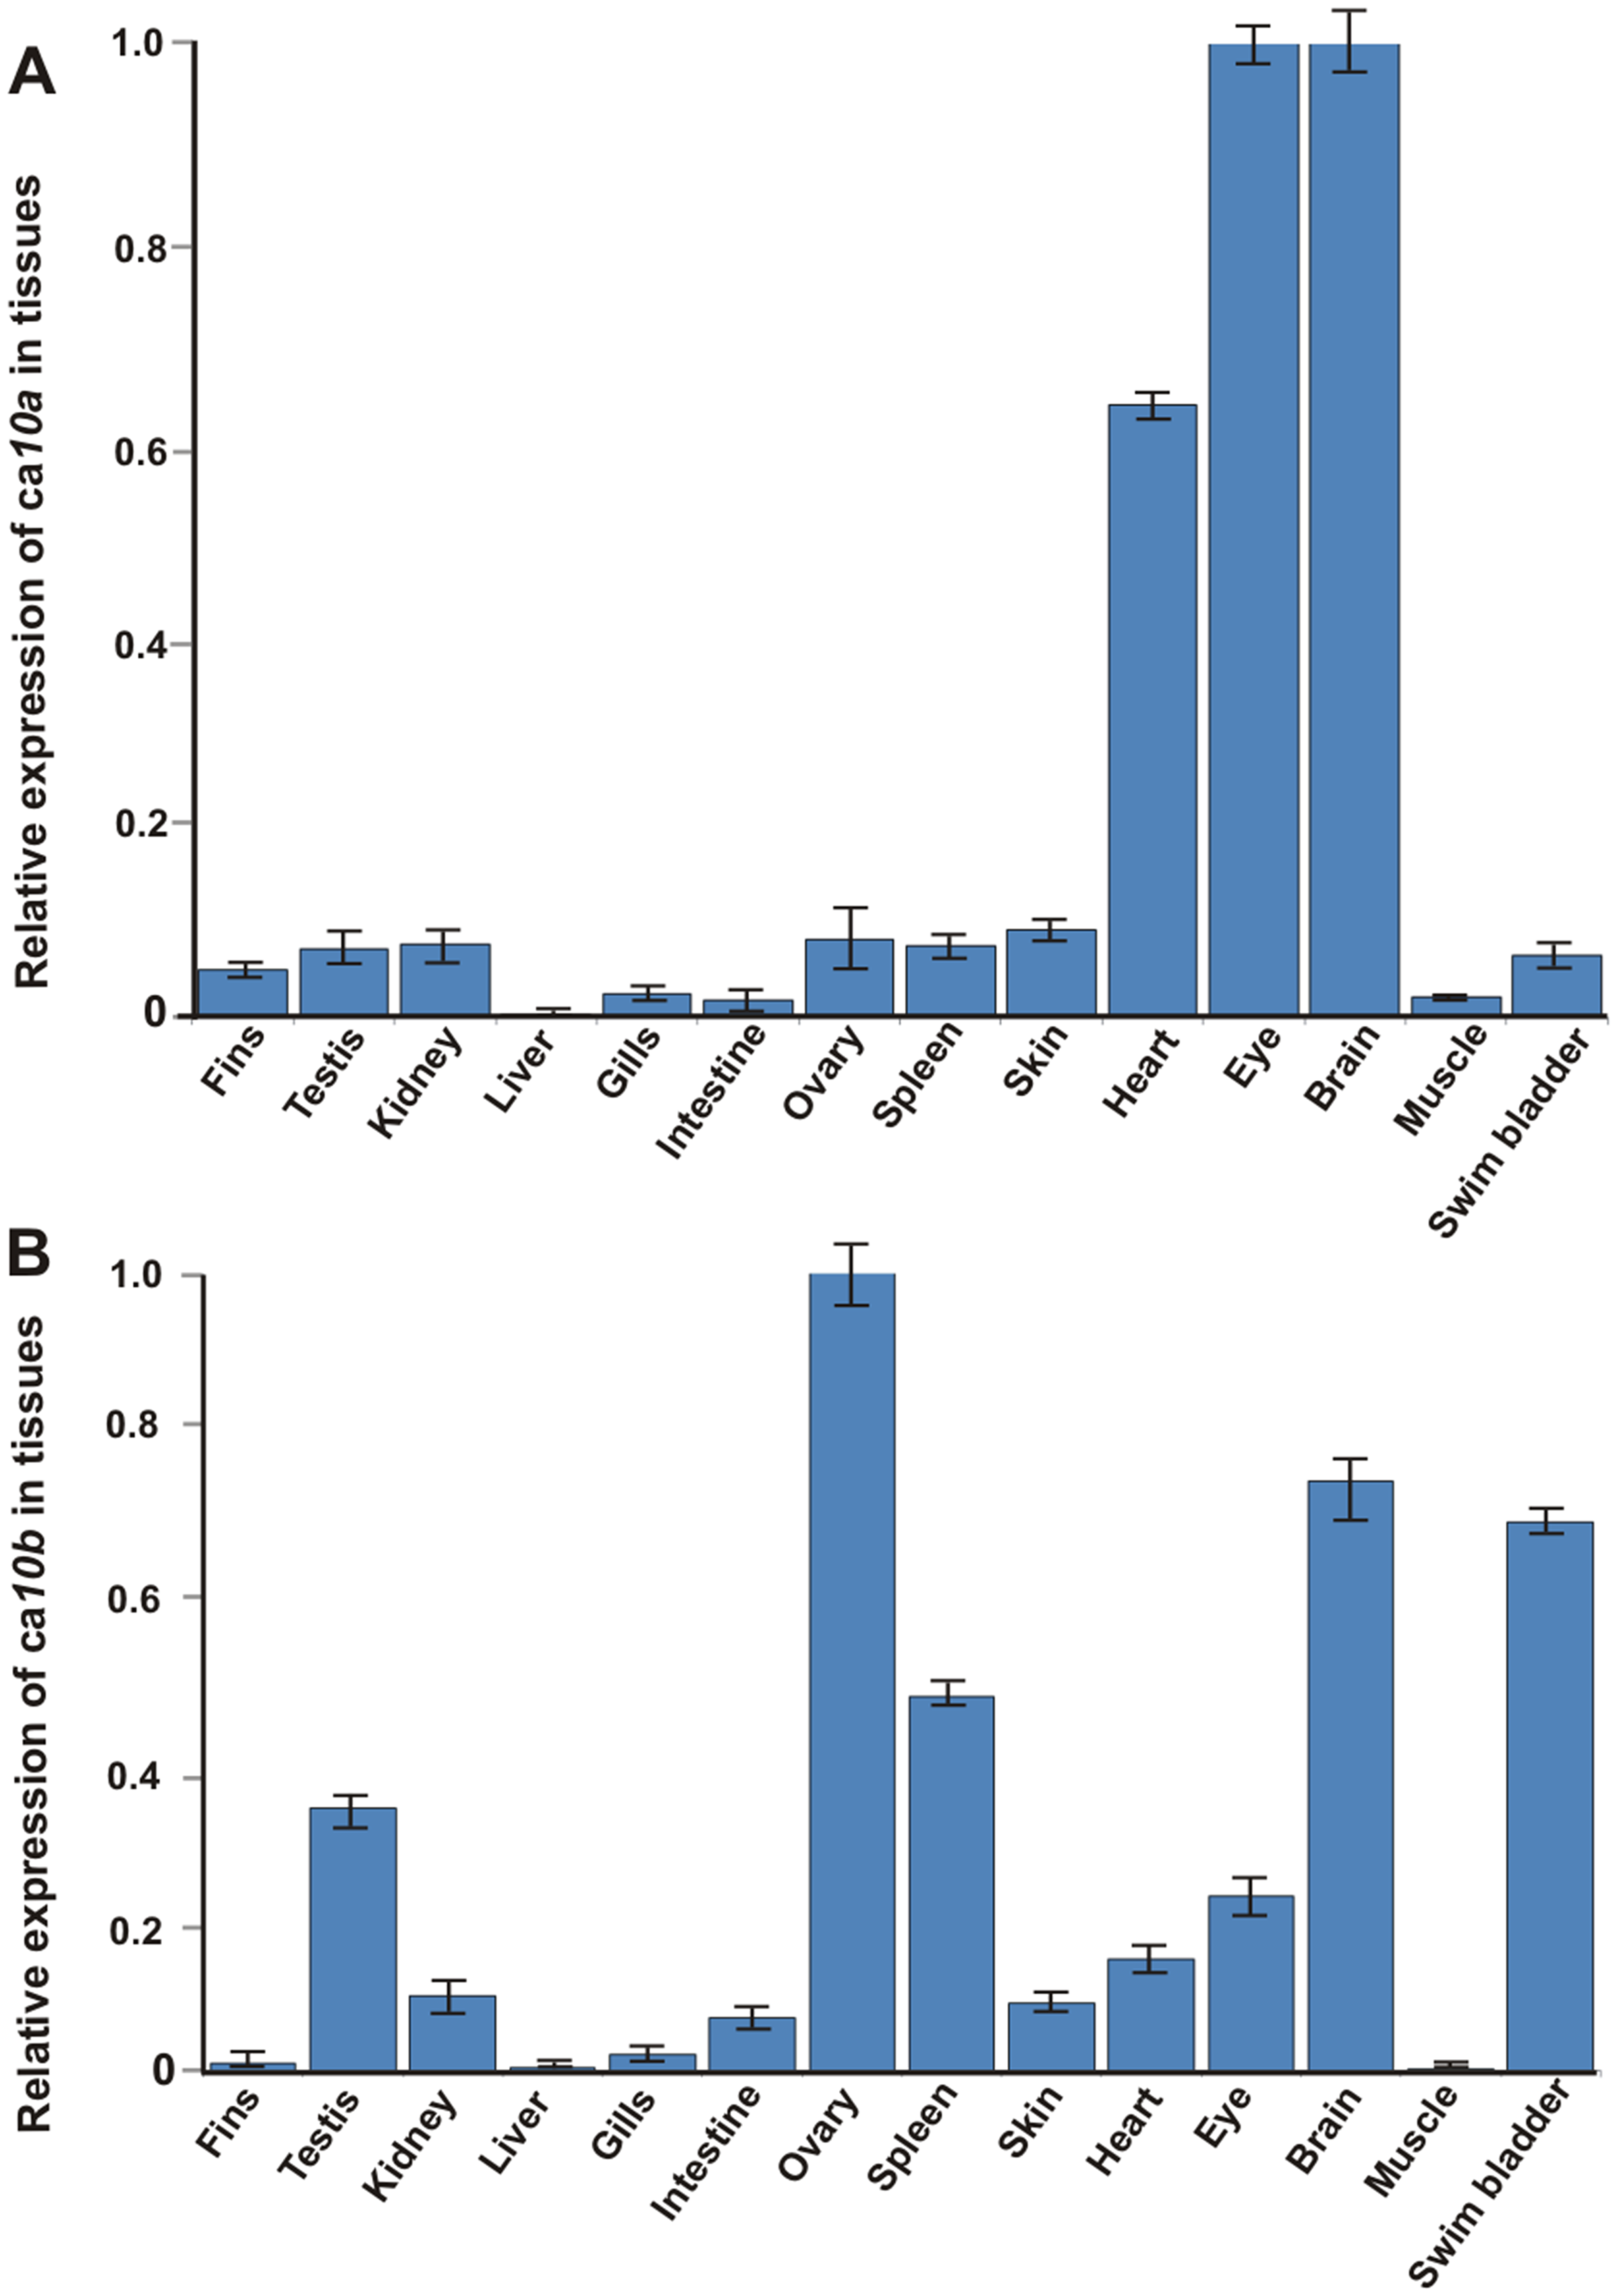
Fig. 5
Expression levels of ca10a and ca10b genes in adult zebrafish tissues.
A quantitative analysis of ca10a and ca10b genes was made for 14 adult zebrafish tissues using RT-qPCR. A, expression of ca10a in zebrafish tissues; B, expression of ca10b in zebrafish tissues. The values were normalized to the beta actin control according to the Pfaffl´s equation [34]. The expression of the ca10a gene in brain and ca10b in the ovary assigned a relative value of 1.
Figure Data
Acknowledgments
This image is the copyrighted work of the attributed author or publisher, and
ZFIN has permission only to display this image to its users.
Additional permissions should be obtained from the applicable author or publisher of the image.
Full text @ PLoS One