
|
Fig. 2
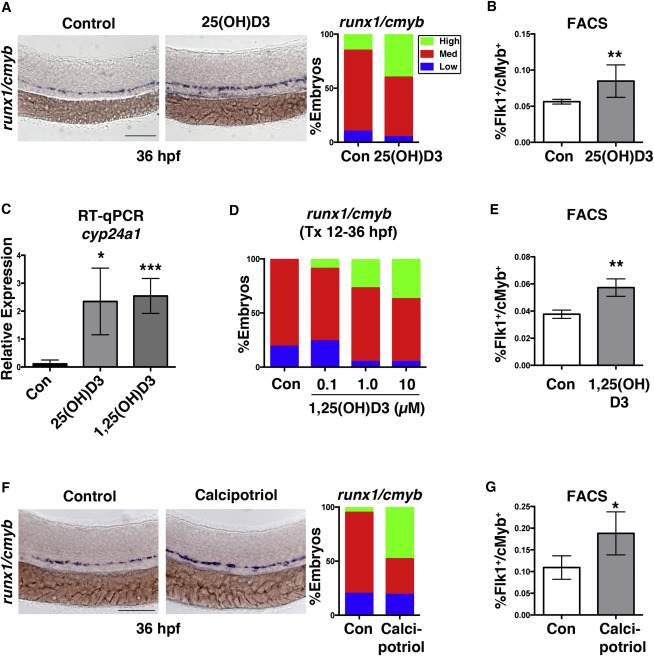
1,25(OH)D3 Regulates HSPC Numbers via Vitamin D Receptor Signaling
(A) Representative runx1/cmyb WISH images and qualitative phenotype distribution following 25(OH)D3 exposure from 12–36 hpf (n ≥ 40 embryos/condition).
(B) FACS analysis of 25(OH)D3-treated (10 μM) embryos showed a significant increase in HSPCs (∗∗p < 0.01) (5 embryos/sample × 4 replicates/condition). Error bars, mean ± SD.
(C) qPCR analysis indicated a significant induction in the VDR transcriptional target cyp24a1 at 36 hpf after exposure to 25(OH)D3 (∗p < 0.05) or 1,25(OH)D3 (∗∗∗p < 0.001) (12–36 hpf) (30 pooled embryos/condition × 3 replicates).
(D) Phenotype distribution of runx1/cmyb expression in embryos exposed to increasing concentrations of 1,25(OH)D3 from 12–36 hpf (n ≥ 30 embryos/condition).
(E) FACS analysis of 1,25(OH)D3-treated (10 μM) embryos showed a 20% increase in HSPCs at 48 hpf (∗∗p < 0.01) compared with controls (n value and error bars as in B).
(F) runx1/cmyb WISH and phenotype distribution after exposure to the non-calcemic vitamin D3 analog calcipotriol (n ≥ 30 embryos/condition).
(G) FACS analysis of calcipotriol-treated embryos showed a significantly more HSPCs (∗p < 0.05) at 36 hpf (n value and error bars as in B).
Scale bars, 100 μm. See also Figure S2.