
Image
|
Figure Caption
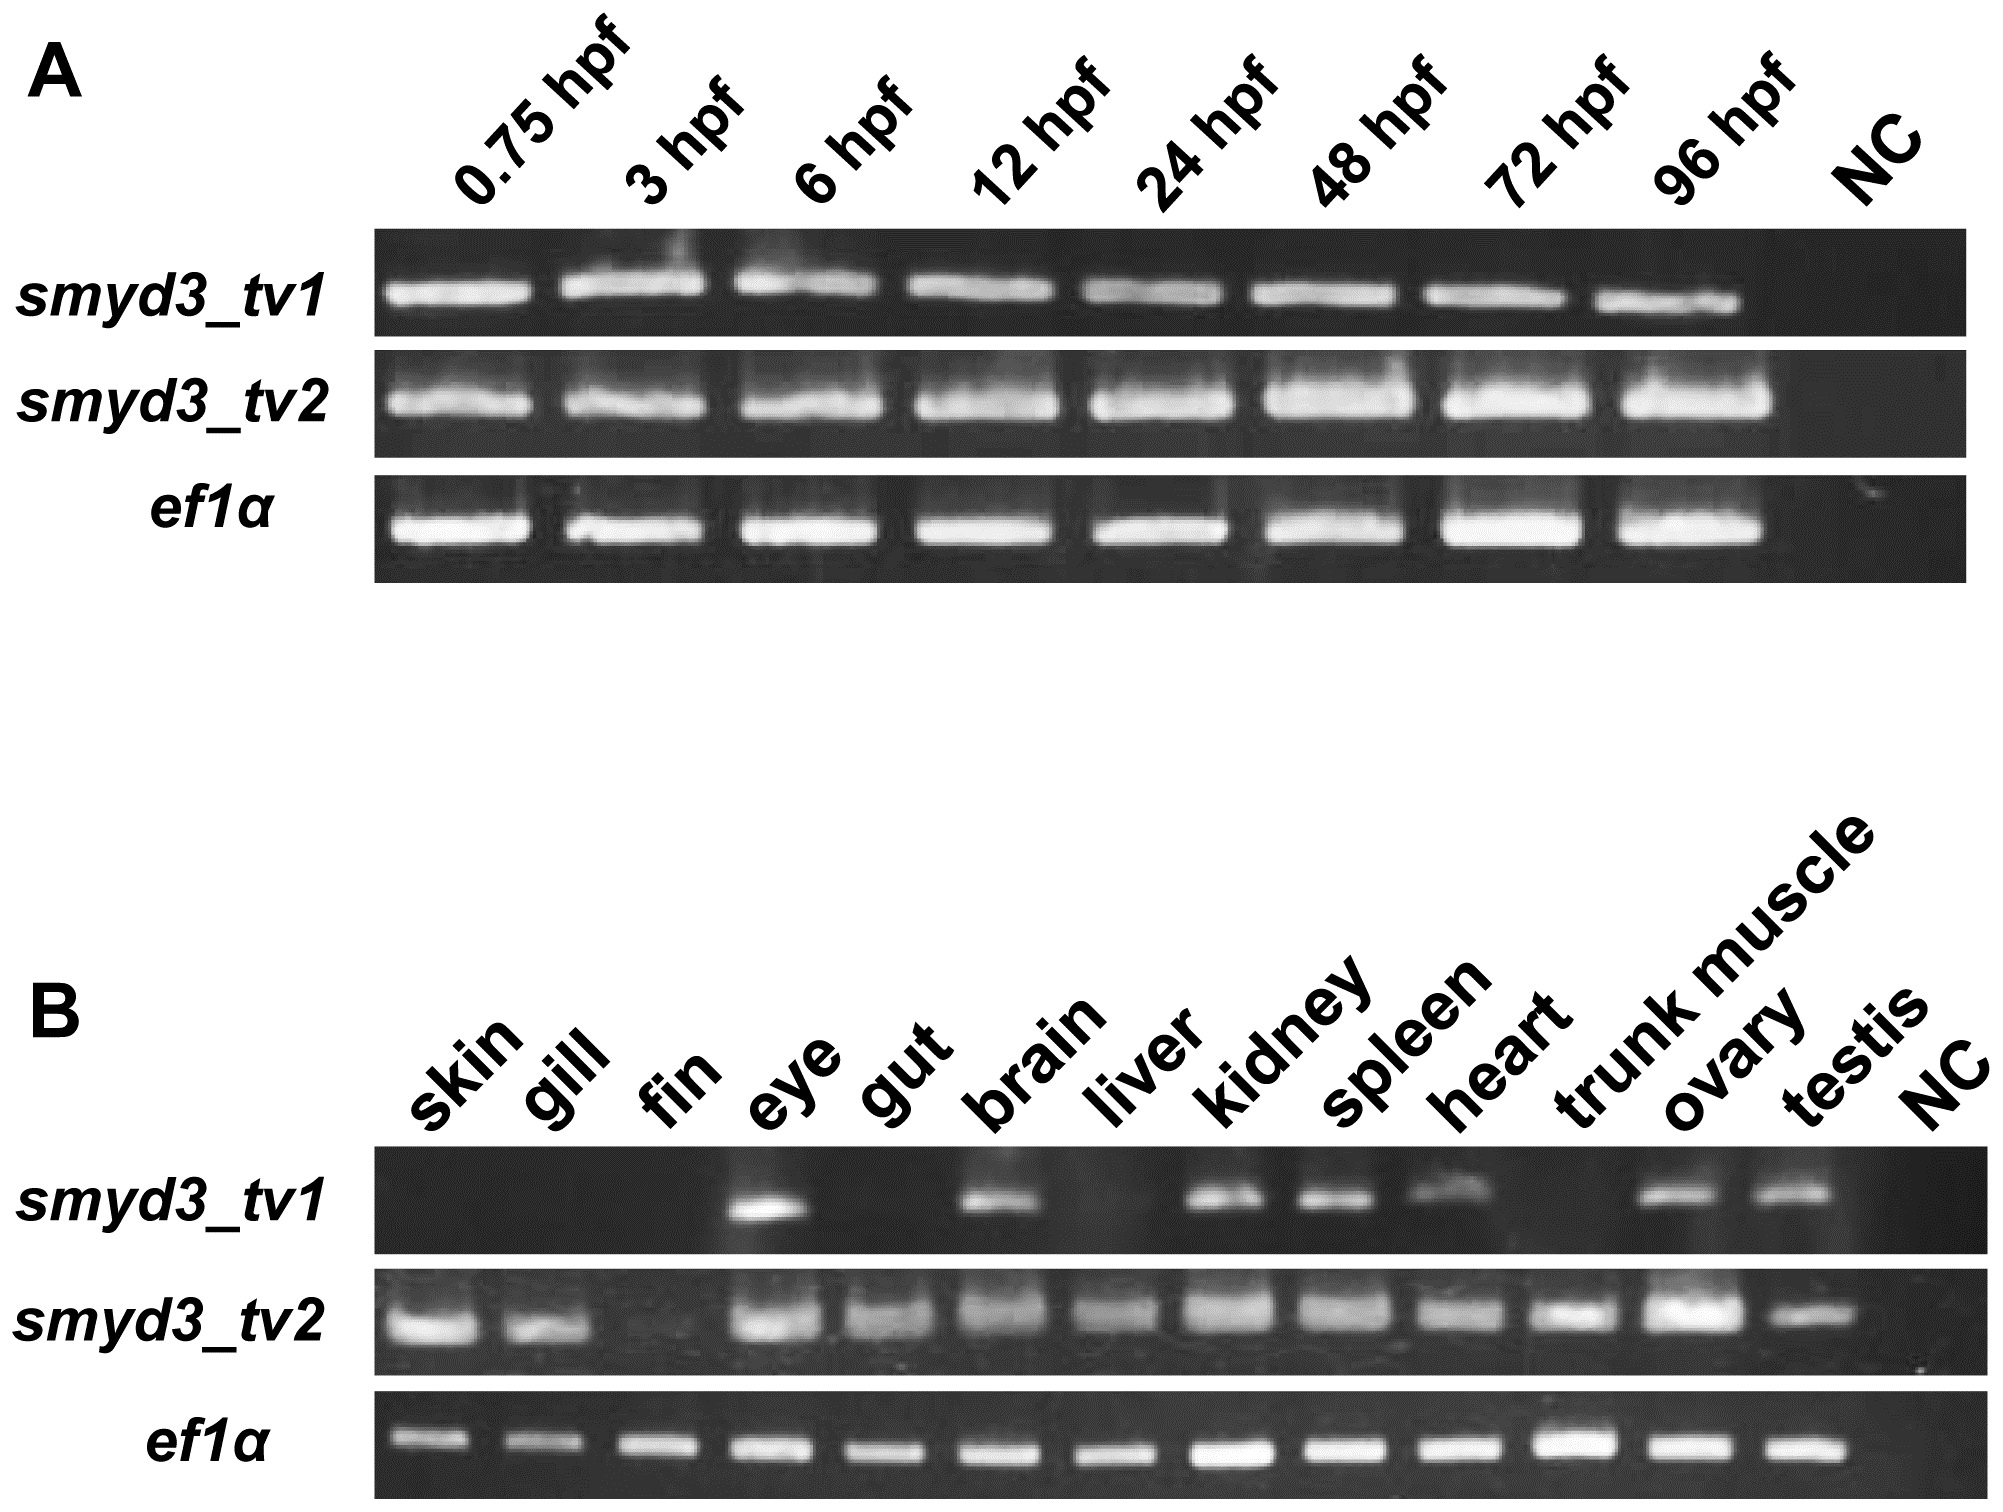
Fig. 1
Expression of smyd3_tv1 and smyd3_tv2 in the developing zebrafish embryos and adult tissues (A) RT-PCR analysis was performed using smyd3_tv1 and smyd3_tv2-specific primer sets, with RNA extracted from zebrafish embryos at 0.75, 3, 6, 12, 24, 48, 72, and 96 hpf. NC: negative control (RNase free water).
Expression of ef1α served as an internal control. (B) Expression of smyd3_tv1 and smyd3_tv2 in various adult tissues.
Figure Data
Acknowledgments
This image is the copyrighted work of the attributed author or publisher, and
ZFIN has permission only to display this image to its users.
Additional permissions should be obtained from the applicable author or publisher of the image.
Full text @ PLoS One