
Image
|
Figure Caption
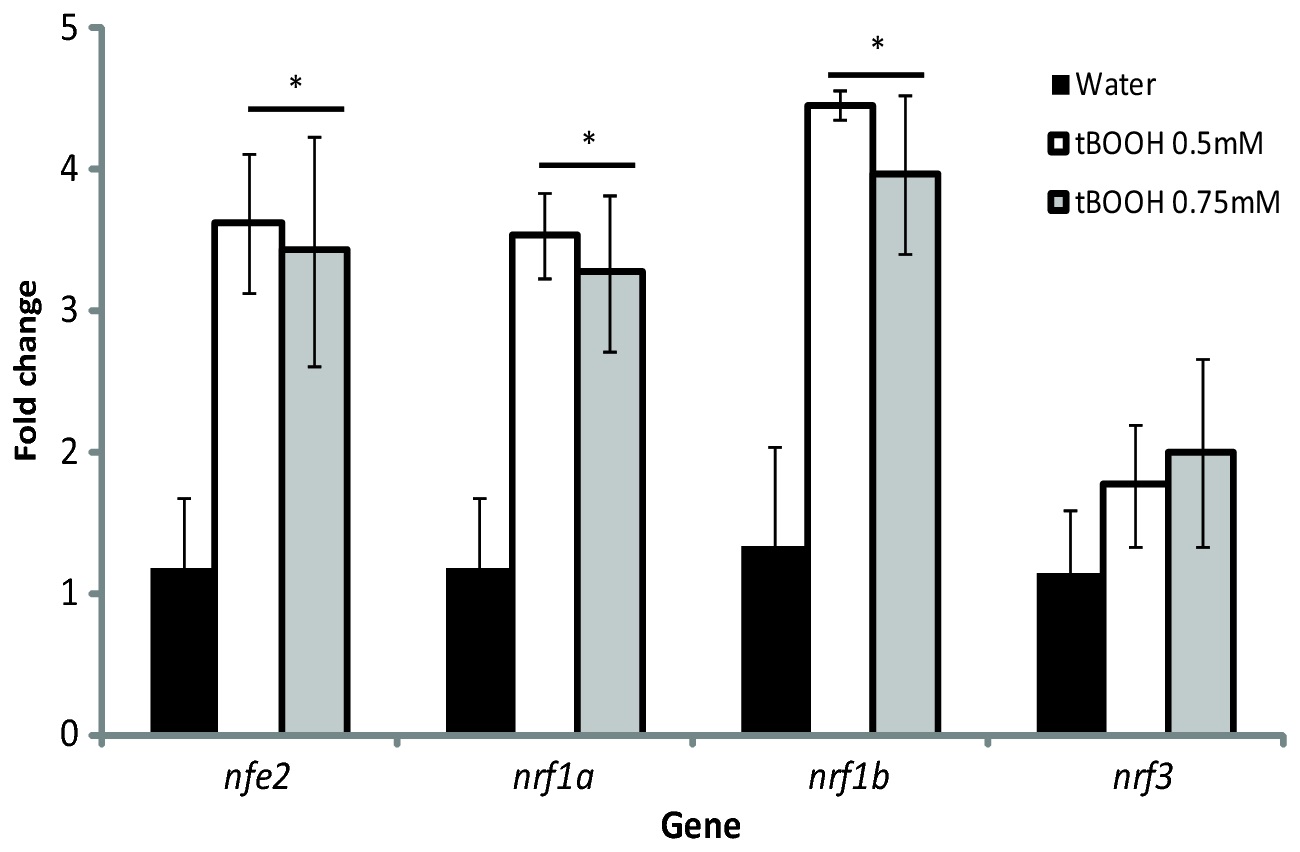
Fig. 7
Expression of nrf genes following tBOOH exposure at 96 hpf.
Larvae were exposed to either water (black bars), 0.5mM tBOOH (white bars), or 0.75mM tBOOH (grey bars) for 6 hours and then sampled. Values were normalized to the water control within each gene and β-actin 1 was used as the housekeeping gene. Fold change data are presented as the mean ± S.E.M. (error bars), and N = 3 pools of 25 embryos. Data were analyzed using ANOVA and Fisher′s PLSD (*, p ≤ 0.05).
Figure Data
Acknowledgments
This image is the copyrighted work of the attributed author or publisher, and
ZFIN has permission only to display this image to its users.
Additional permissions should be obtained from the applicable author or publisher of the image.
Full text @ PLoS One