
|
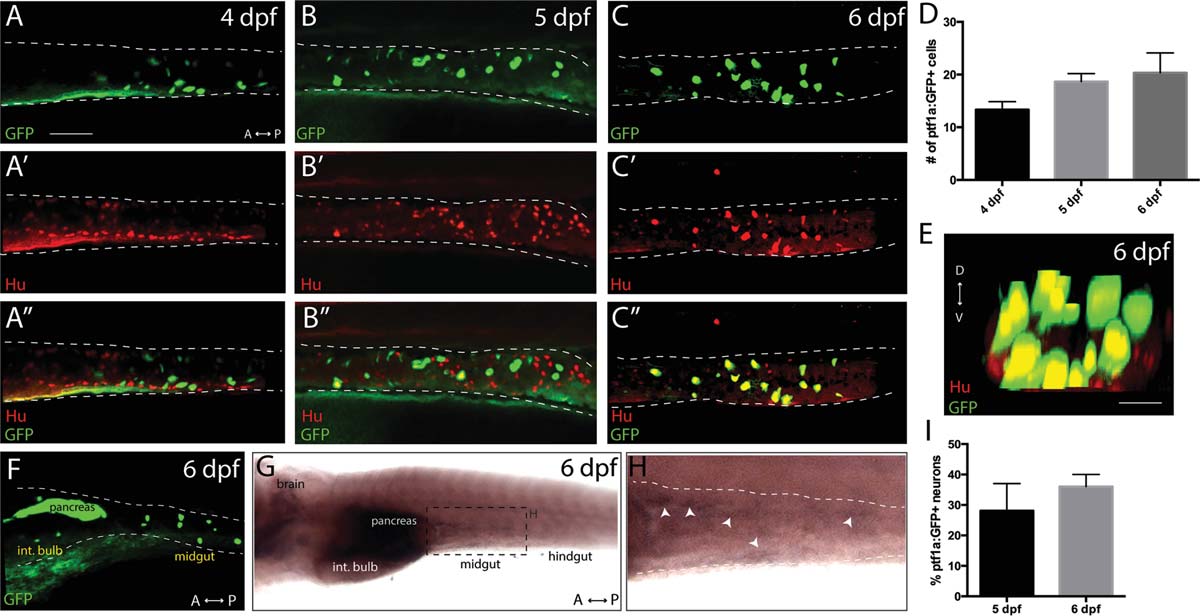
Fig. 1
The transgenic line Tg(ptf1a:GFP) marks a subset of neurons within the larval ENS. Maximum projection confocal stacks at (A-A′′) 4 dpf, (B-B′′) 5 dpf and (C-C′′) 6 dpf depicting ptf1a:GFP+ and Hu+ cells within the midgut (dashed lines), scale bar: 70 microns, for A-C. (D) Bar graph illustrating total number of ptf1a:GFP+ cells in the gut from 4 dpf to 6 dpf, error bars represent s.e.m., n=6. (E) Maximum intensity confocal projection along the z-axis reveals that ptf1a:GFP+/Hu+ cells co-localize in a concentric pattern along the gut tube at 6 dpf, scale bar: 100 microns. (F) Lateral view of a 6 dpf ptf1a:GFP+ larval fish. (G, H) Ventrolateral view following whole mount in situ hybridization against ptf1a reveals that ptf1a localizes to the brain, pancreas and midgut of 6 dpf larvae. (I) Bar graph illustrating the percentage of total Hu+ neurons that are ptf1a:GFP+ in the midgut at 5 dpf and 6 dpf, error bars represent s.e.m., n = 6. Int. bulb-intestinal bulb.