
|
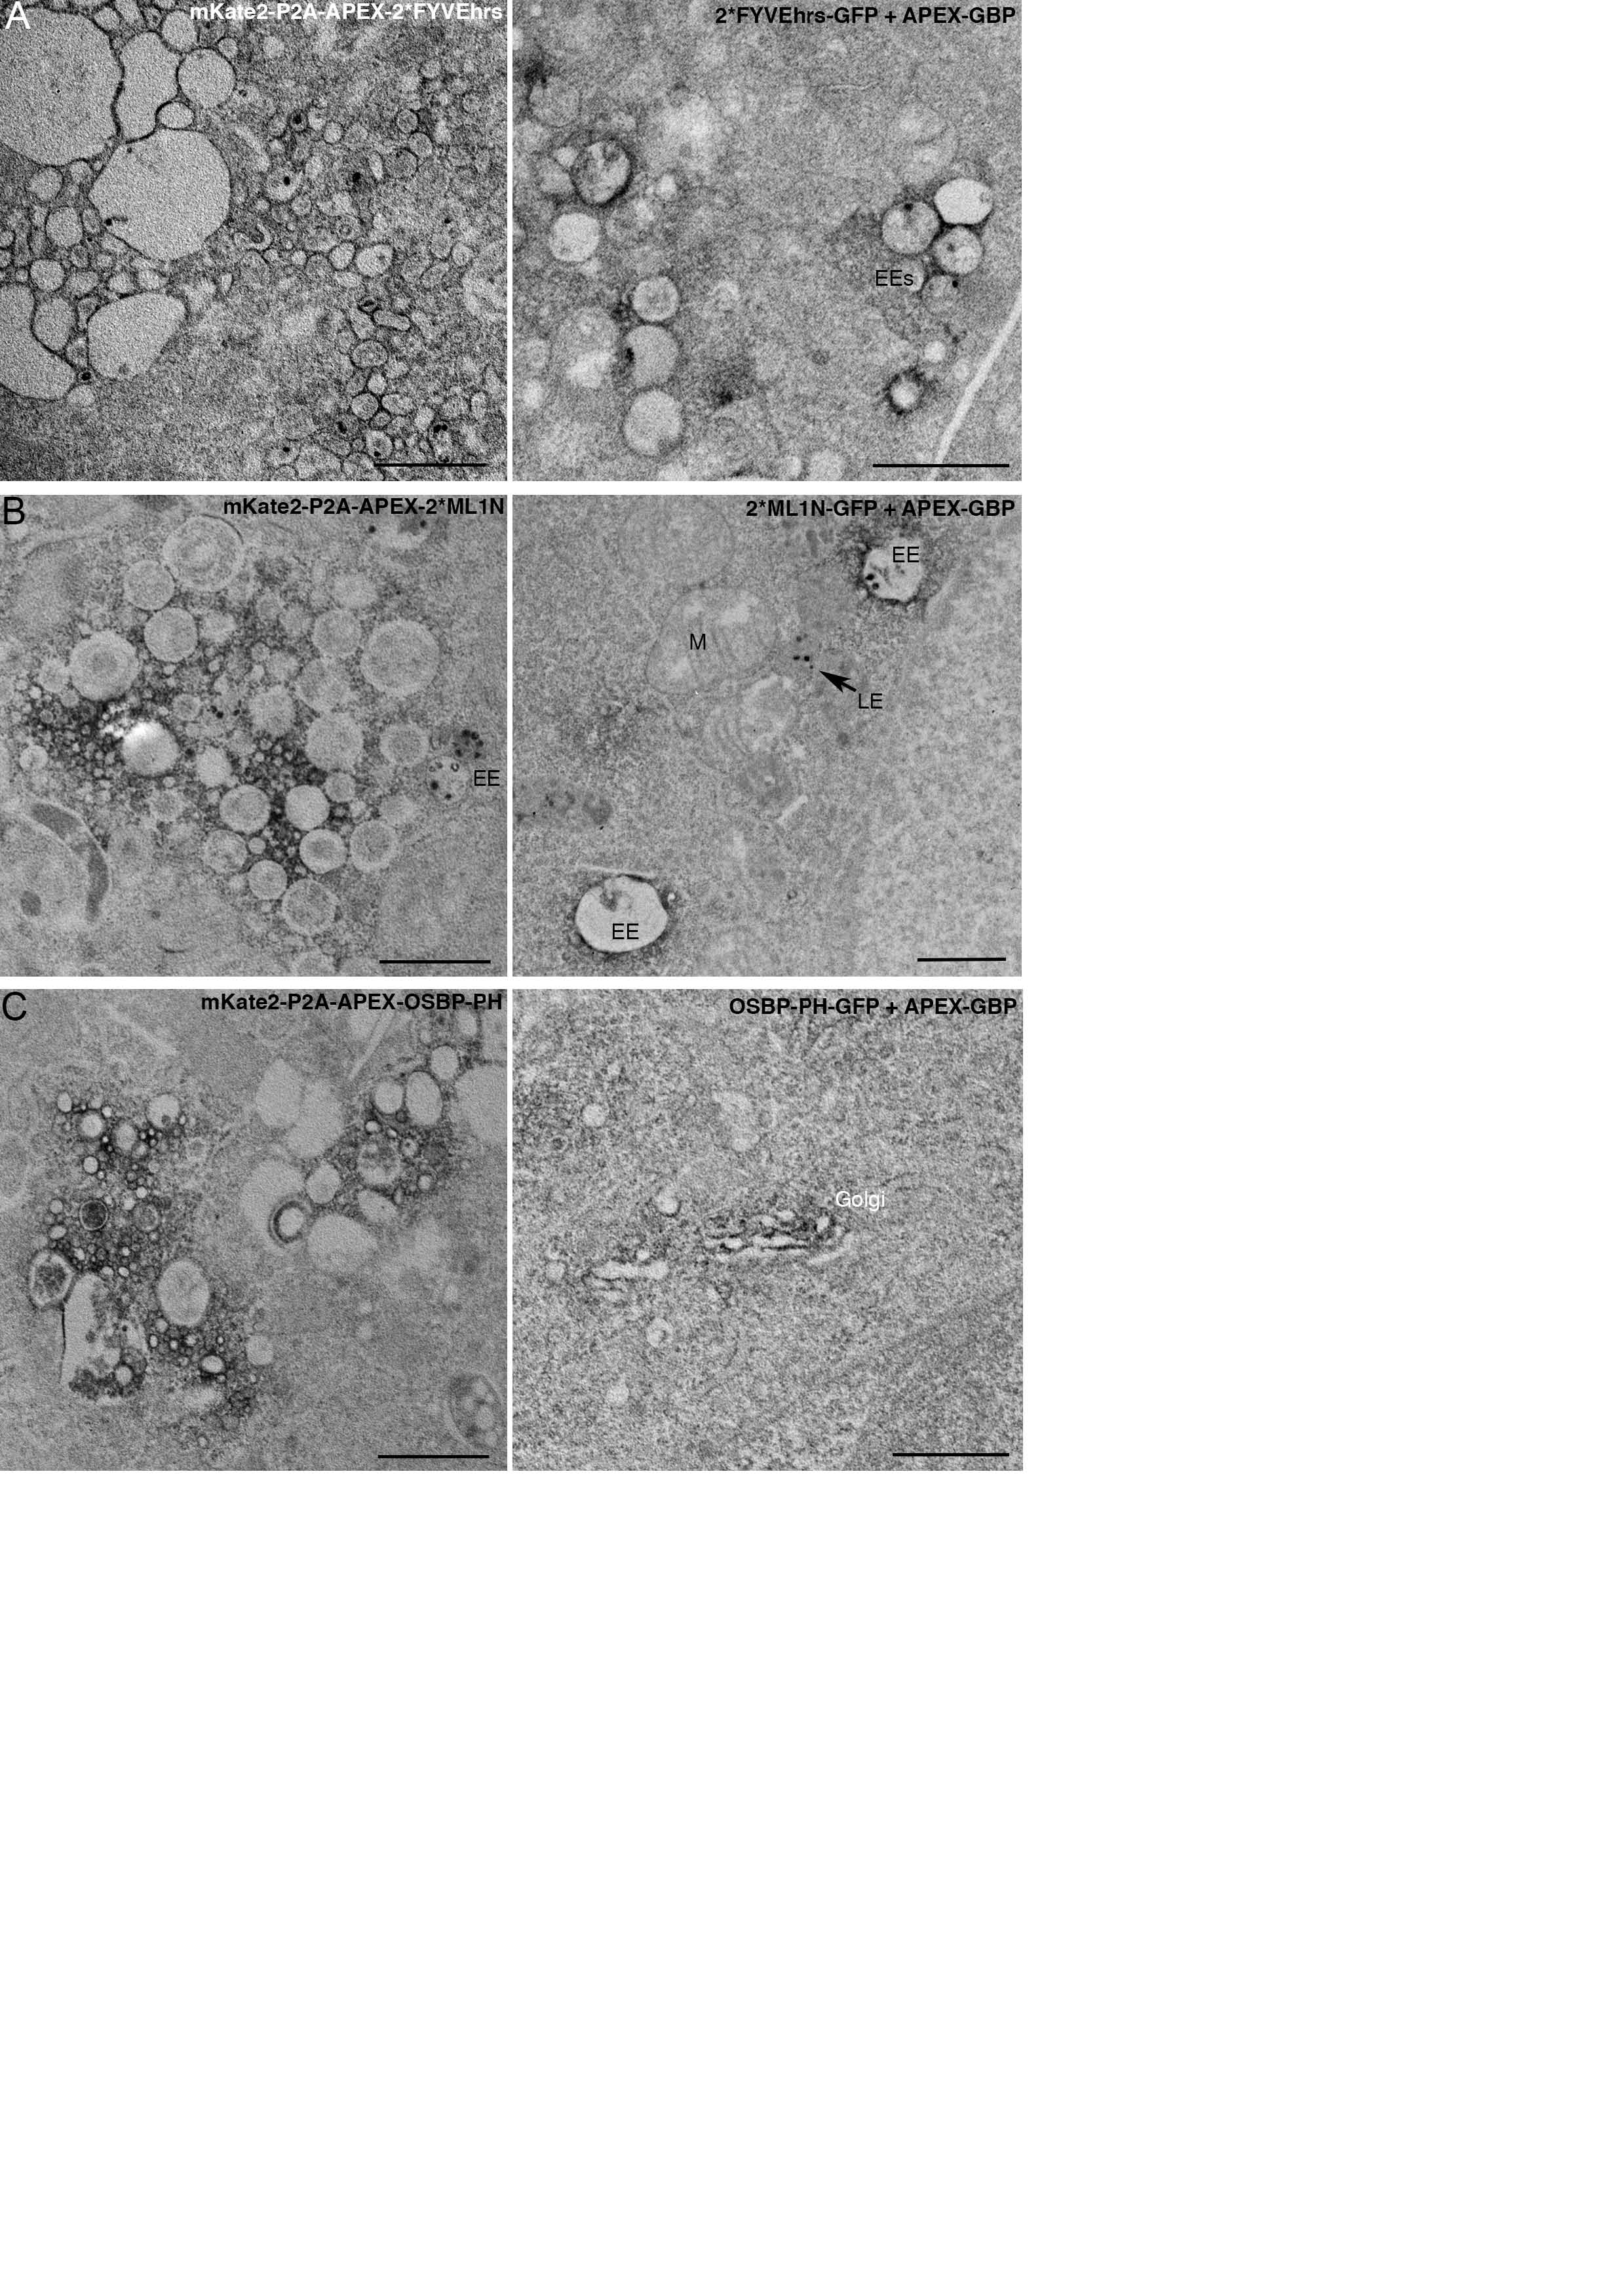
Fig. S4 The expression of some directly tagged APEX phosphoinositide probes disrupted normal endomembrane morphology compared to APEX-GBP. A) mKate2-P2A-APEX-2*FYVEhrs expression (left panel) alters early endosome morphology compared to GFP-2*FYVEhrs + APEX-GBP (right panel). B) mKate2-P2AAPEX- 2*ML1N (left panel) expression disrupts late endosome morphology compared to GFP-2*ML1N + APEX-GBP (right panel). C) mKate2-P2A-APEX-OSBP-PH (left panel) expression affects Golgi complex morphology compared to GFP-OSBP-PH + APEX-GBP (right panel). EEs = early endosomes, LE = late endosomes, Golgi = Golgi complex, M = mitochondria. Scale bars = 1 µm.
Reprinted from Developmental Cell, 35(4), Ariotti, N., Hall, T.E., Rae, J., Ferguson, C., McMahon, K.A., Martel, N., Webb, R.E., Webb, R.I., Teasdale, R.D., Parton, R.G., Modular Detection of GFP-Labeled Proteins for Rapid Screening by Electron Microscopy in Cells and Organisms, 513-25, Copyright (2015) with permission from Elsevier. Full text @ Dev. Cell