
Image
|
Figure Caption
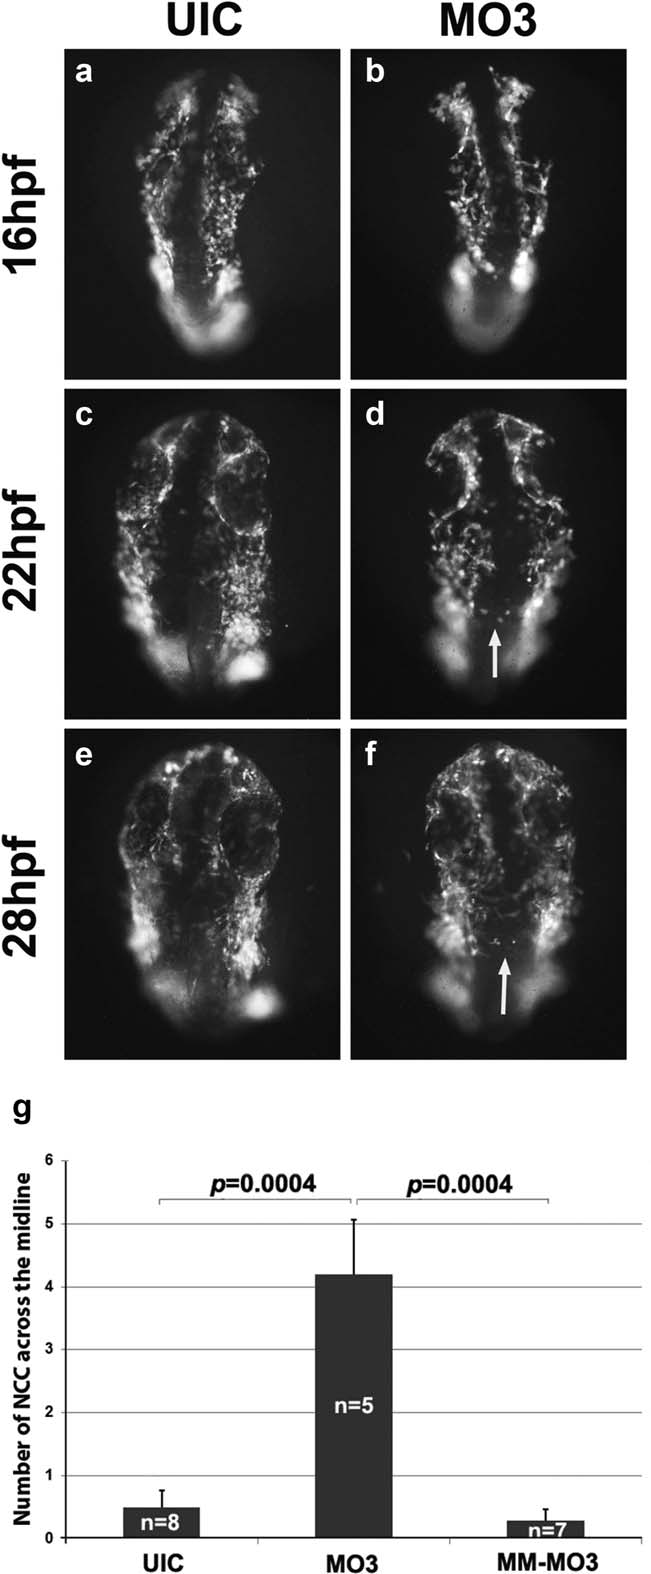
Fig. 1
NCC migration is disorganized in MO3 morphants. Time-lapse live cell imaging captures of sox10:GFP embryos showing migrating NCC cells at 16 (a, b), 22 (c, d), and 28 hpf (e, f). UIC (a, c, and e) and MO3-injected embryos (b, d, and f) showing a dorsal view of migrating NCCs. White arrows point to abnormally migrating NCCs. (g) Quantification of number of cells crossing the midline in UIC, MO3 and control MM-MO3 injected embryos.
Figure Data
Acknowledgments
This image is the copyrighted work of the attributed author or publisher, and
ZFIN has permission only to display this image to its users.
Additional permissions should be obtained from the applicable author or publisher of the image.
Full text @ Genesis