
|
Fig. 1
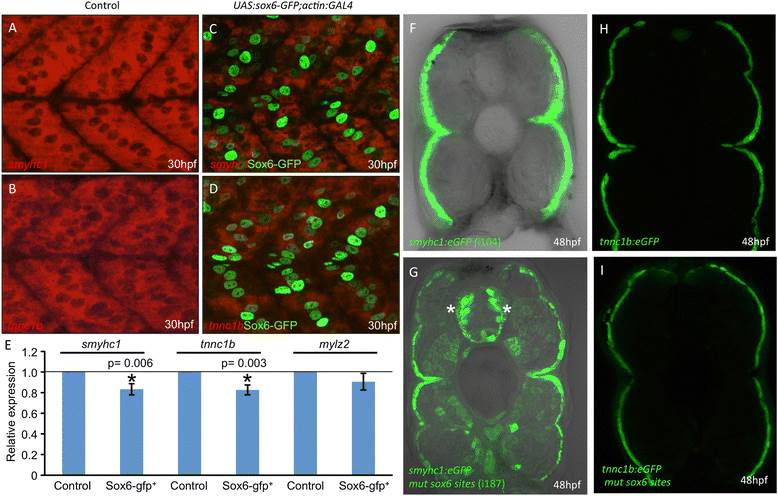
Control of slow-twitch specific gene expression by Sox6.(A,B) Fluorescent in situ hybridization of 30 hours postfertilization (hpf) wild-type embryos revealing accumulation of smyhc1 and tnnc1b transcripts throughout the mononucleated slow-twitch muscle; (C,D) transgenic embryos expressing Sox6-GFP in slow-twitch fibers (green nuclei) hybridized under identical conditions to the wild-type controls (A,B) showing reduced levels of smyhc1 and tnnc1b transcripts; (E) graphical representation of data pooled from three independent qPCR analyses of smyhc1, tnnc1b and mylz2 transcription in control and UAS:sox6-GFP;actin:GAL4 (sox6-gfp+) embryos at 30 hpf. Student’s two-tailed, unpaired t-test, error bars represent standard deviation, control n = 3, sox6-gfp+ n = 3, asterisks indicate significance; (F) Cross section through a trunk somite of a 48 hpf smyhc1:GFP transgenic embryo; note that expression is restricted to the superficially located slow-twitch muscle fibers; (G) similar preparation of an embryo transgenic for the same smyhc1:GFP reporter gene in which the putative Sox6 binding sites have been mutated: note the ectopic expression in many fast-twitch muscle fibers as well as in prominent clusters of neurons in the neural tube (asterisks). (H) Cross section through a trunk somite of a 48 hpf tnnc1b:GFP transgenic embryo: expression is similarly restricted to the slow-twitch fibers. (I) Similar preparation of a 48 hpf embryo transgenic for the same reporter in which the putative Sox6 binding sites have been mutated: note the absence of ectopic expression of this transgene.