
|
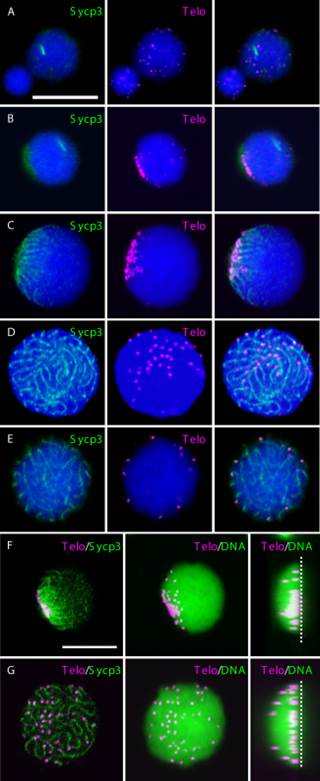
Fig. 4
Analysis of the dynamics of meiotic telomeres in zebrafish by performing FISH using a telomere probe in combination with immunocytochemical labeling of Sycp3. Telomeres were analyzed in chromosome spreads of spermatocytes isolated from adult testis. A–E: Immunocytochemical labeling of Sycp3 in combination with FISH using a telomere probe in spermatocytes at preleptotene (A), early leptotene (B), early zygotene (C), zygotene (D), and pachytene (E) stages. Left panels show Sycp3 staining (green), middle panels show FISH signals (magenta), and right panels show merged images of the left and middle panels. Nuclei were stained with TO-PRO-3 (blue). F,G: Three-dimensional analysis of meiotic cells. Serial optical sections were obtained using confocal laser microscopy, and 3D images were reconstructed using software attached to the microscope after double staining of Sycp3 and telomeres in spermatocytes at leptotene (F) and zygotene (G) stages. Left panels show representative examples of single plane images obtained from the serial sections. Sycp3 and telomere signals are displayed in green and magenta, respectively. Middle and right panels show axial and lateral views, respectively, of the 3D reconstructed images. Telomere signals and nuclear staining are displayed in magenta and green, respectively. In the right panels, the surface of the glass slide is represented by a white dashed line. Bars = 10 µm.