
|
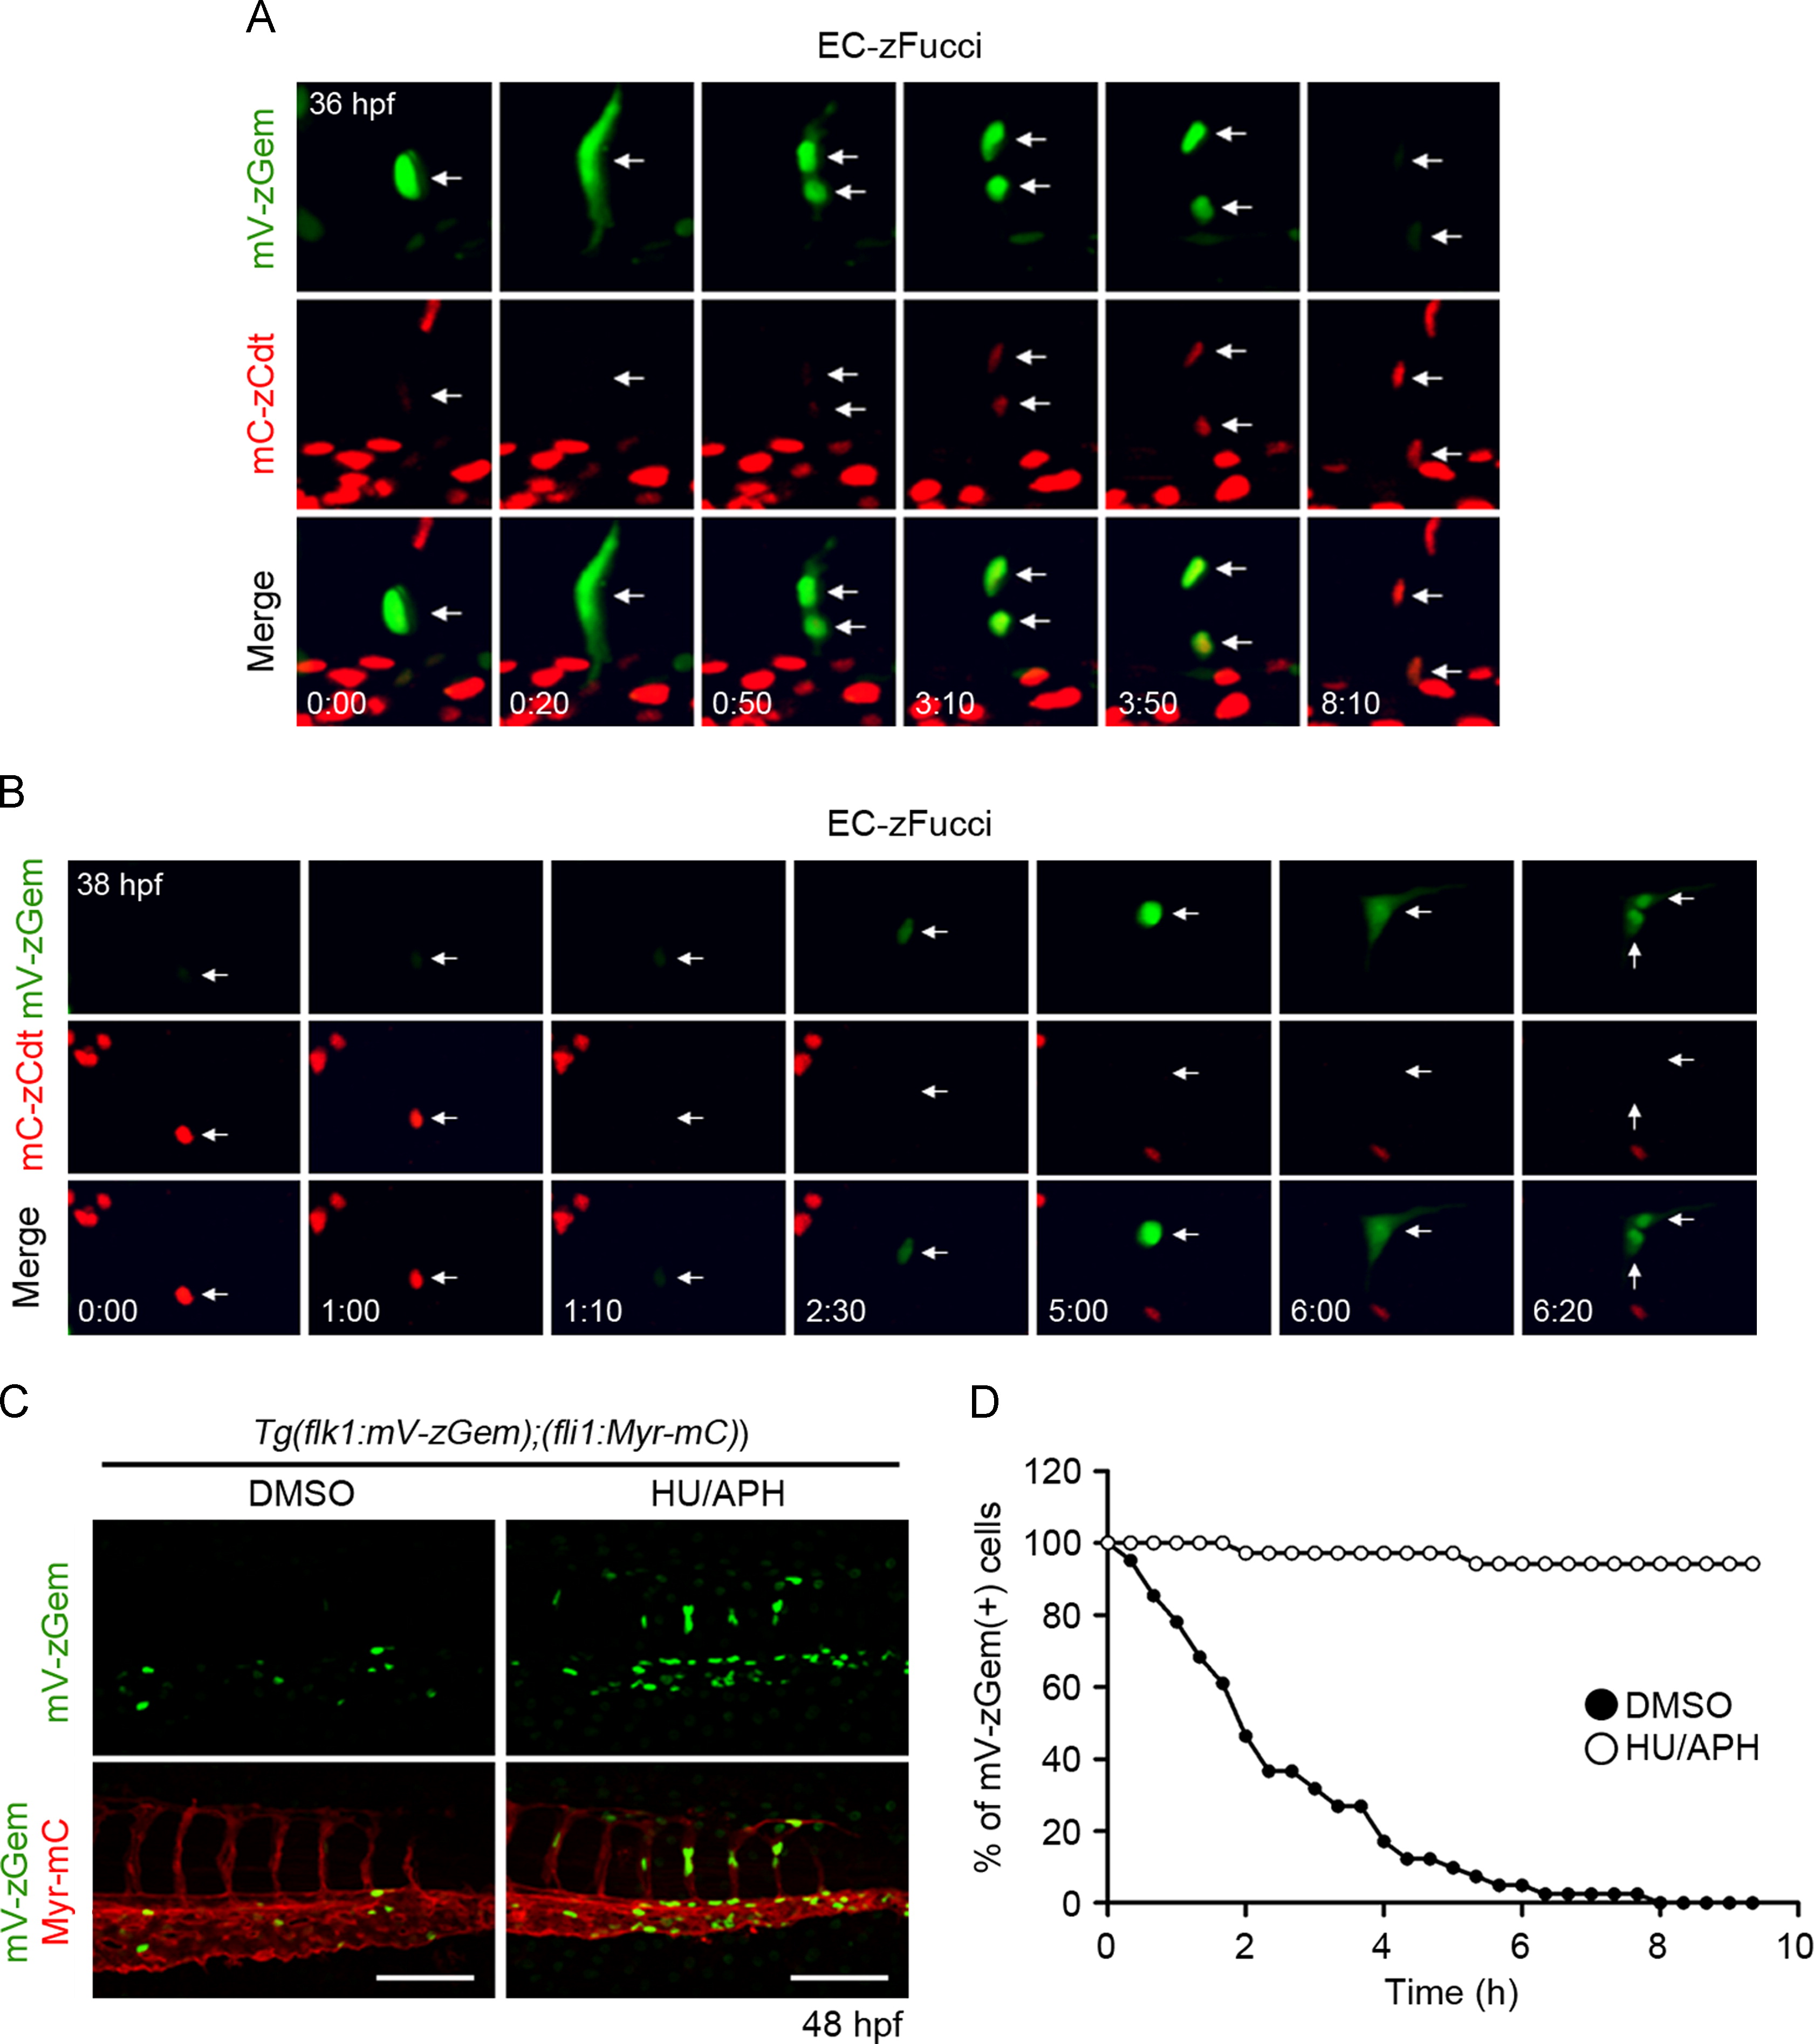
Fig. 2
Validation of the EC-zFucci Tg fish line. (A) Confocal 3D fluorescence image of the intersegmental vessel (ISV) of an EC-zFucci embryo at 36 hpf (first column) and the corresponding subsequent time-lapse images (from second to sixth columns) at the elapsed time (h:min) indicated at the bottom. Top, mVenus images; middle, mCherry images; bottom, the merged images. Note that an mV-zGem-positive cell (arrows at 0:00 and 0:20) divides into two daughter cells (arrows at 0:50), which subsequently lose mVenus fluorescence and start to emit mCherry fluorescence (arrows at 3:10, 3:50 and 8:10). (B) Confocal 3D fluorescence image of the ISV of an EC-zFucci embryo at 38 hpf (first column) and the corresponding subsequent time-lapse images (from second to seventh columns) at the elapsed time (h:min) indicated at the bottom are shown, essentially as in A. Note that the mC-zCdt-positive cell (arrows at 0:00 and 1:00) loses mCherry fluorescence (arrow at 1:10), starts to emit mVenus fluorescence (arrows at 2:30, 5:00 and 6:00), and subsequently divides into two daughter cells (arrows at 6:20 and 7:00). (C) 3D-rendered confocal images of the caudal regions of 48 hpf Tg(flk1:mV-zGem);(fli1:Myr-mC) embryos treated with either DMSO or both hydroxyurea and aphidicolin (HU/APH) from 30 to 48 hpf. Upper, mVenus images; lower, the merged images of mVenus and mCherry. Scale bars, 100 μm. (D) Duration: time that mVenus-positive cells in the EC-zFucci Tg embryos at 36 hpf continue to emit mVenus fluorescence. Tg(flk1:mV-zGem);(fli1:Myr-mC) embryos were treated from 30 hpf with either DMSO (closed circles) or HU/APH (open circles), and time-lapse imaged starting at 36 hpf for 9 h 20 min to track the mVenus-positive cells. The y-axis indicates the number of mVenus-positive cells, while the x-axis shows the time after starting the time-lapse imaging. Data are expressed as percentages relative to that observed at the beginning of the imaging (DMSO [n=35], HU/APH [n=41]).
Reprinted from Developmental Biology, 393(1), Fukuhara, S., Zhang, J., Yuge, S., Ando, K., Wakayama, Y., Sakaue-Sawano, A., Miyawaki, A., Mochizuki, N., Visualizing the cell-cycle progression of endothelial cells in zebrafish, 10-23, Copyright (2014) with permission from Elsevier. Full text @ Dev. Biol.