
|
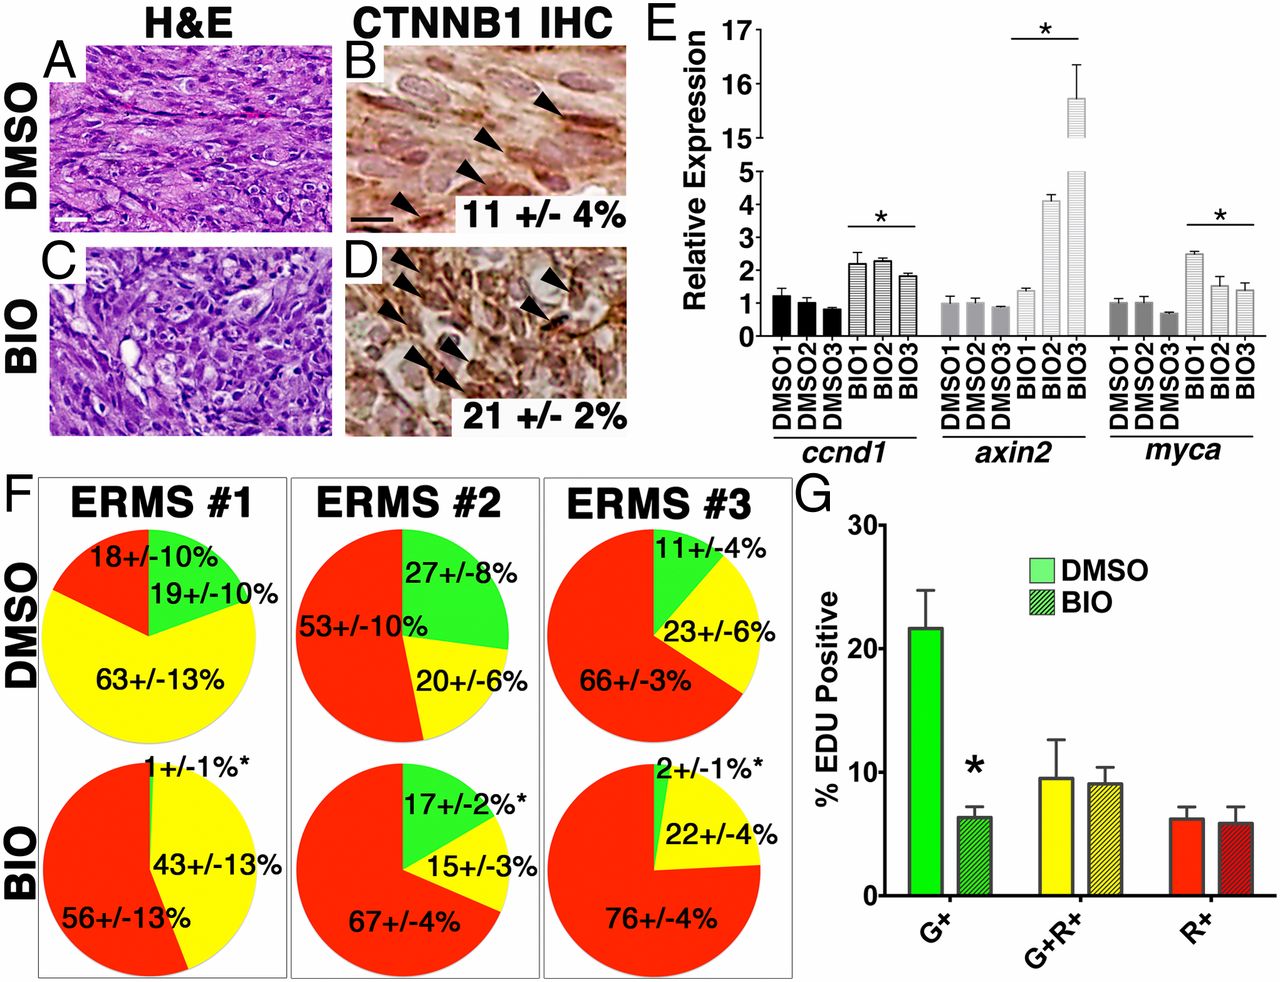
Fig. 4
BIO activates canonical WNT/β-catenin signaling and induces differentiation of ERMS cells in vivo. (A–D) H&E-stained sections (A and C) and immunohistochemistry for β-catenin (B and D) of ERMS-bearing fish after 7 d of drug treatment with BIO (300 nM) or DMSO (vehicle control). (Scale bar, 25 μM.) (E) Quantitative RT-PCR analysis. (F) Pie charts showing the relative percentage of myf5:GFP+/mylz2:mCherry TPCs (green), myf5:GFP+/mylz2:mCherry+ (yellow), and late-differentiating myf5:GFP/mylz2:mCherry+ cells (red) for three independent ERMS as assessed by FACS (n > 3 animals per experimental arm and ±SD). *Statistically significant differences between DMSO and BIO treatments (Student t test, P < 0.05). (G) Summary of EDU staining of DMSO- or BIO-treated tumors. Each error bar indicates SEM of three tumors from each treatment group. *P < 0.005, Student t test.