
Fig. 5
|
Fig. 5
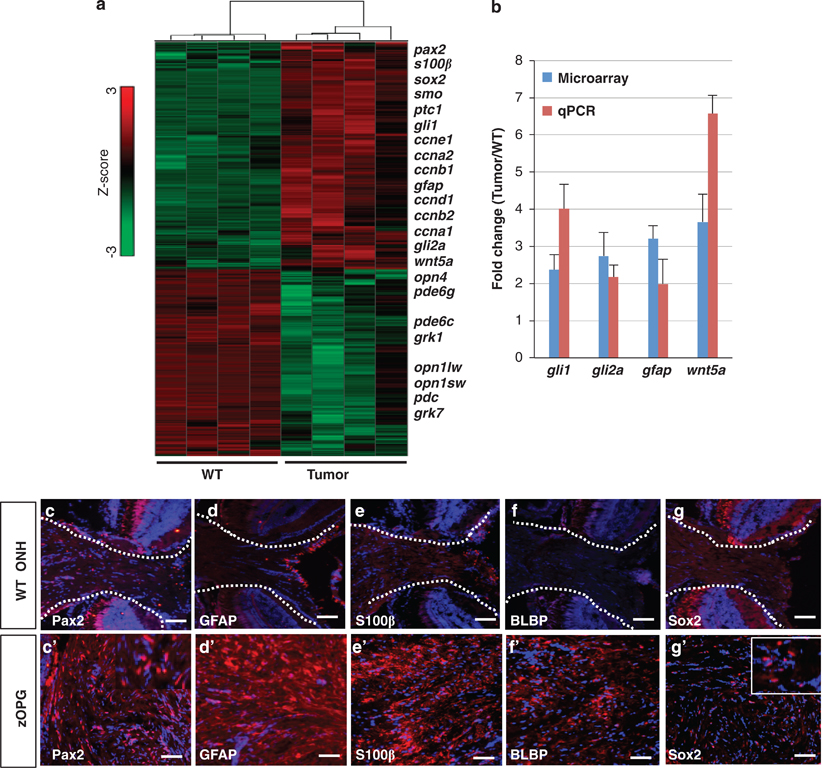
Differentially expressed genes and a radial glia cell signature of the zOPGs. (a) A heatmap generated by hierarchical clustering showing differentially expressed genes for wild-type (WT) and retinal tumors, respectively. The color scale (Z-score) is denoted on the right, with red showing upregulation and green showing downregulation. A subset of upregulated genes is listed on the right. (b) Upregulation of gli1, gli2a, gfap and wnt5a was confirmed by real-time quantitative PCR (qPCR). Microarray data represent the average expression from four eye tumors versus four control eyes. qPCR data are from the same four samples performed in quadruplicate. All data were normalized to actin b1expression. Error bars show s.d. (c–g2) Series of cryosections from a single fish with typical zOPG showed overexpression of the astrocyte/radial glia markers of Pax2 (c, c2), GFAP (d, d2), S100β (e, e2), BLBP (f, f2) and the stem cell and glioma marker Sox2 (g, g2) as compared with their respective expression in the ONH of an age-matched WT fish. Fragmented lines demarcate the ONH region. Scale bars, 40μm.