
|
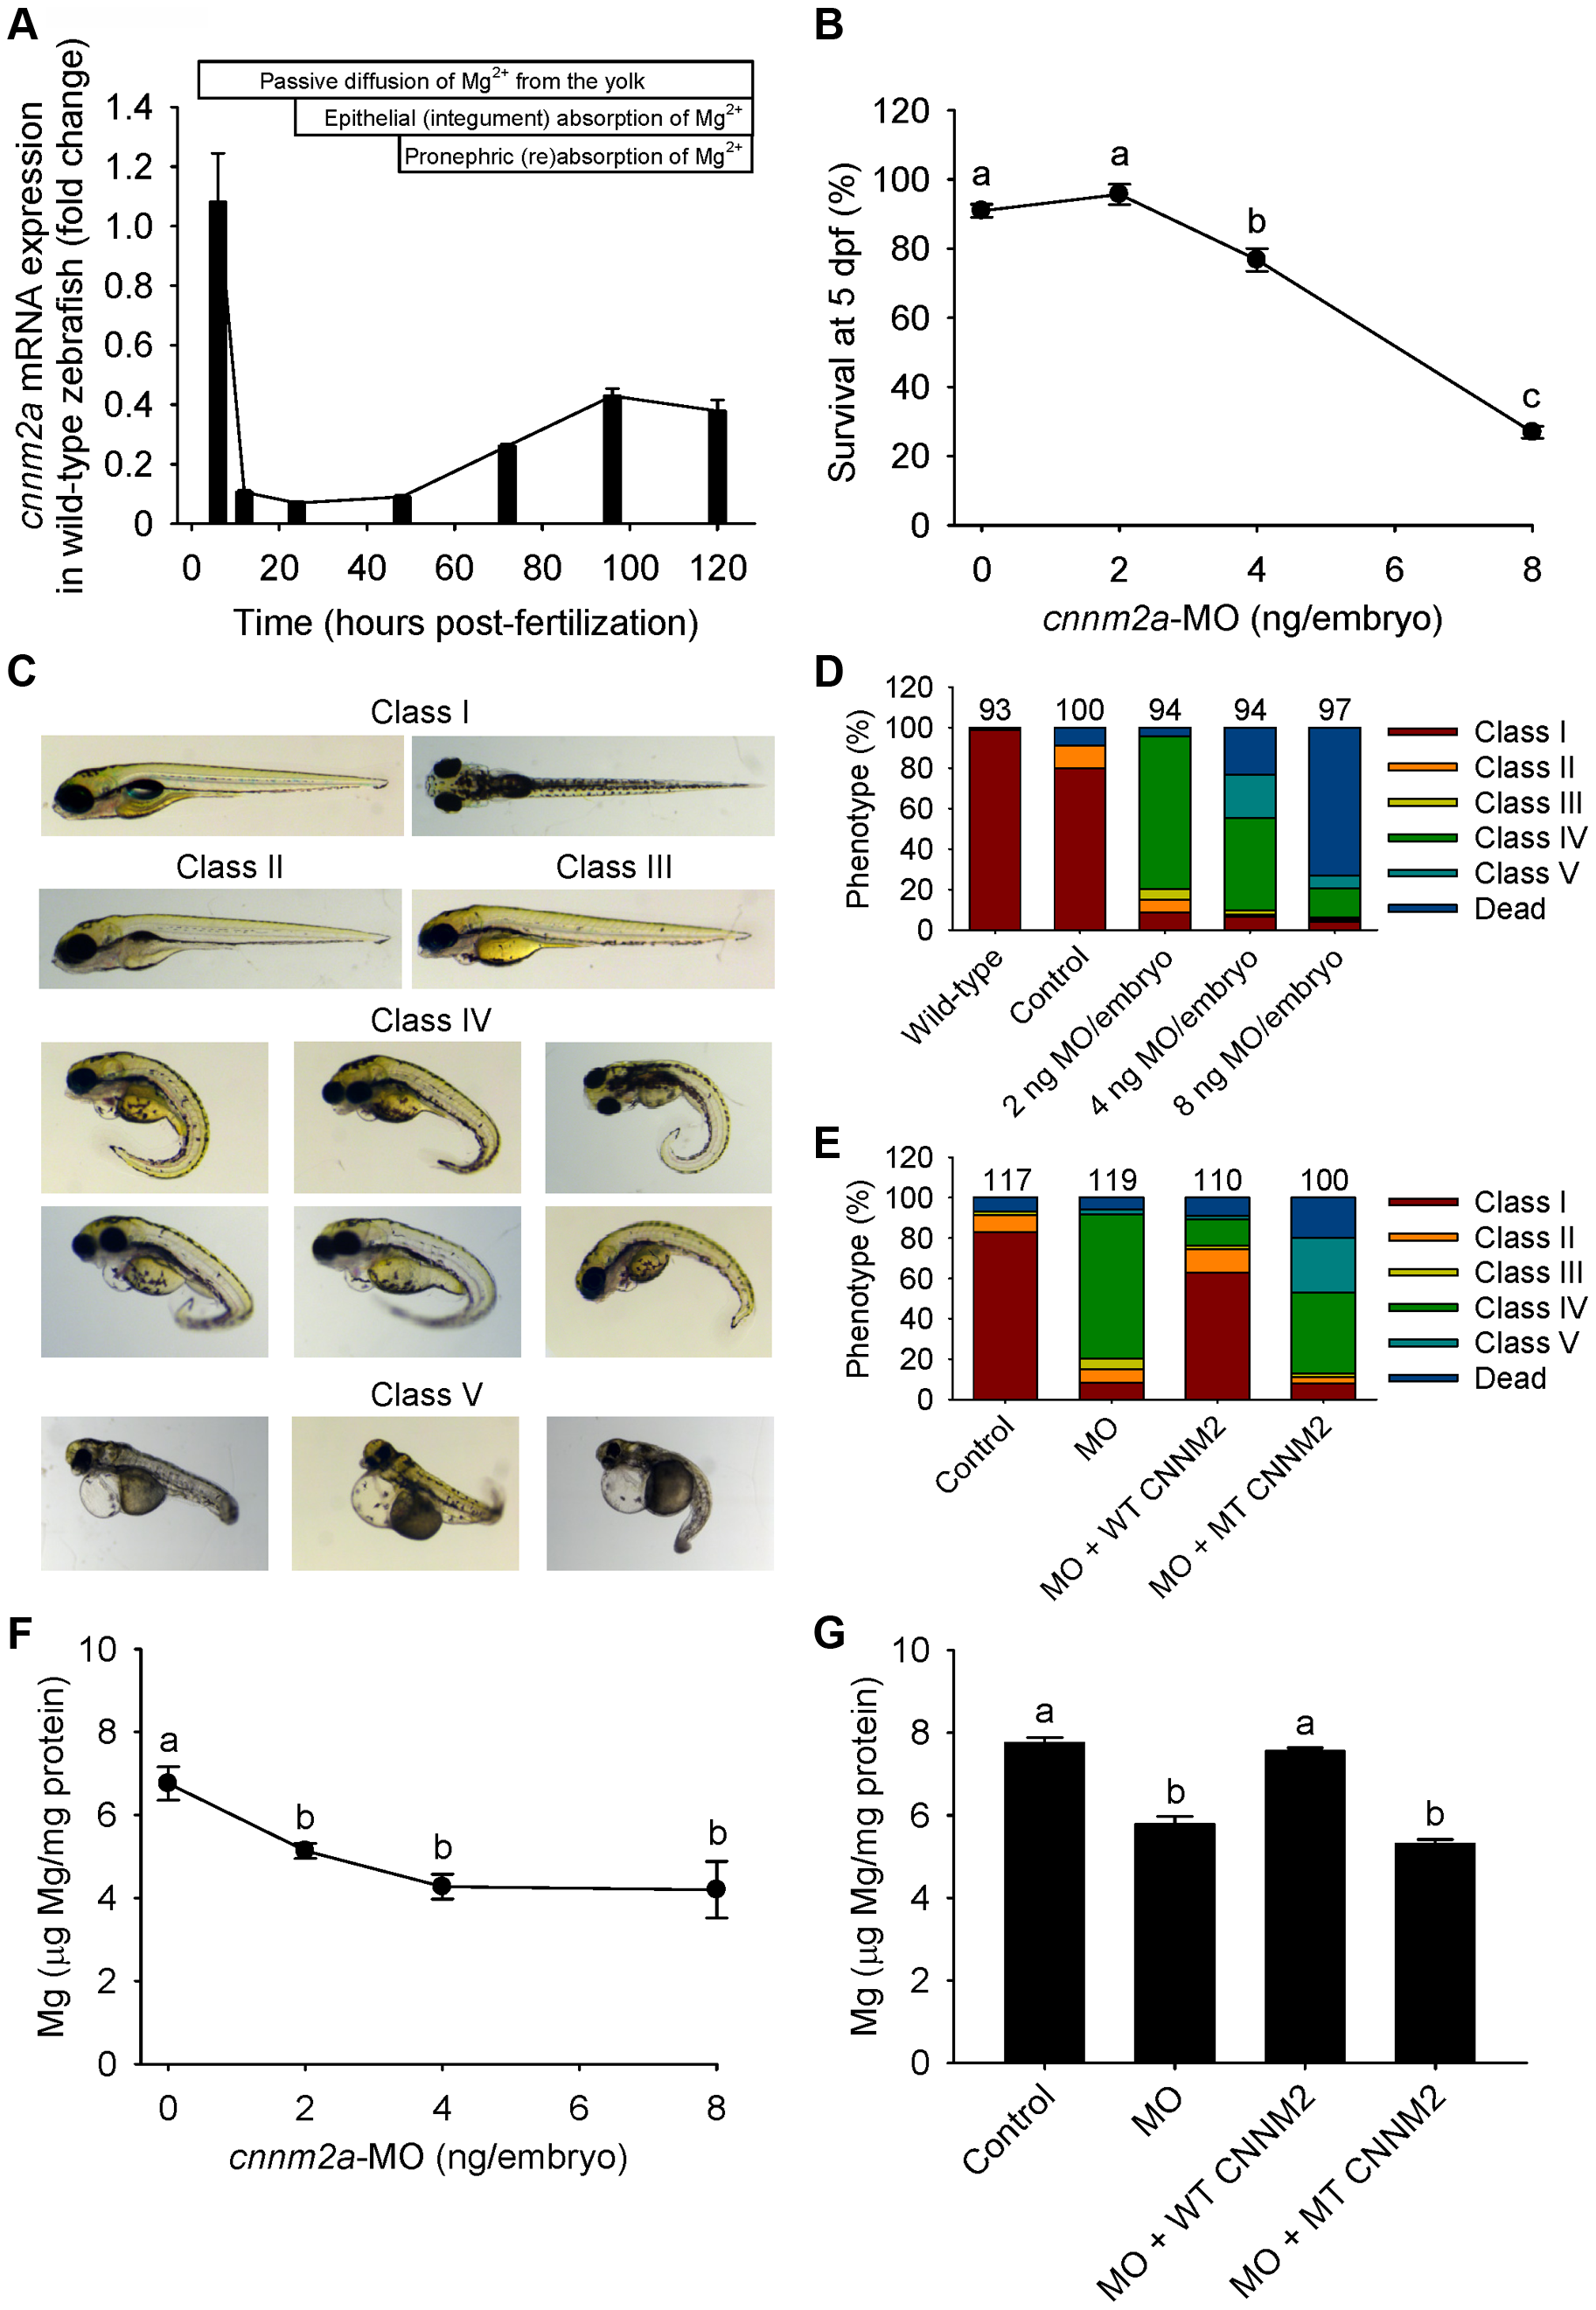
Fig. 4
Knockdown of cnnm2a results in Mg wasting in zebrafish larvae (5 dpf).
(A) mRNA expression of cnnm2a in developing zebrafish. Expression patterns were analysed by RT-qPCR (n = 6 per time point). (B) Survival curve at 5 dpf (n = 3 per experimental condition). The dose of zero represents injection with control-MO. (C) Morphological phenotypes in zebrafish larvae (5 dpf) in cnnm2a knockdown experiments. (D) Distribution of morphological phenotypes in zebrafish larvae (5 dpf) untreated (wild-type) or injected with different doses of cnnm2a-MO or control-MO. Numbers on top of the bars indicate the number of animals in each experimental condition. (E) Distribution of morphological phenotypes in zebrafish larvae at 5 dpf in rescue experiments. The wild-type phenotype (class I) was restored in morphants by co-injection of cnnm2a-MO (2 ng MO/embryo) with wild-type (WT) CNNM2 cRNA (50 pg cRNA/embryo), but not with mutant (MT, p.Glu357Lys) CNNM2 cRNA (50 pg cRNA/embryo). (F) Magnesium content in zebrafish injected with different doses of cnnm2a-MO, the dose of zero represents injection with control-MO (n = 10 per experimental condition except in 8 ng MO-injected zebrafish where n = 5). (G) Rescue of Mg wasting in morphant zebrafish by co-injection of cnnm2a-MO (2 ng MO/embryo) with cRNA encoding for wild-type (WT) CNNM2 (50 pg cRNA/embryo). Co-injection with cRNA encoding for mutant (MT, p.Glu357Lys) CNNM2 (50 pg cRNA/embryo) did not restore Mg levels (n = 10 per experimental condition). Data are presented as mean ± SEM. Different letters indicate significant differences between mean values in experimental groups (P<0.05).