
Fig. 4
|
Fig. 4
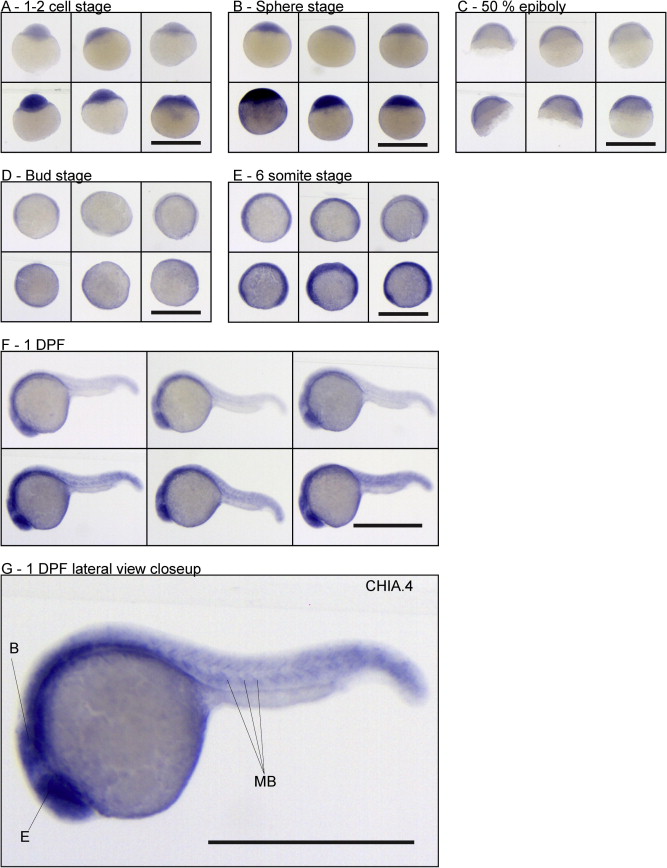
CHIA gene expression from zygote to segmentation. (A–F) In situ hybridization results for the six earliest stages. In each panel the order is the same, top left: CHIA.1; top centre: CHIA.2; top right: CHIA.3; bottom left: CHIA.4; bottom centre: CHIA.5; bottom right: CHIA.6. The bar represents 1 mm in each case. (A–E) No differential pattern of gene expression can be distinguished in any of the initial stages of development. The early peak in CHIA.4 expression ( Fig. 3B) can be clearly seen in panels A and B. After sphere stage, all CHIA appear ubiquituously and lowly expressed (C–E). At 24 HPF the first distinguishable patterns can be seen (F). (G) Scale-up picture of the CHIA.4 ISH result, representative for patterns visible in all ISHs: the signal is concentrated in the developing eye (E) and brain (B), as well as at the myotome borders (MB).
Reprinted from Gene expression patterns : GEP, 14(2), Koch, B.E., Stougaard, J., and Spaink, H.P., Spatial and temporal expression patterns of chitinase genes in developing zebrafish embryos, 69-77, Copyright (2014) with permission from Elsevier. Full text @ Gene Expr. Patterns