
Fig. 3
|
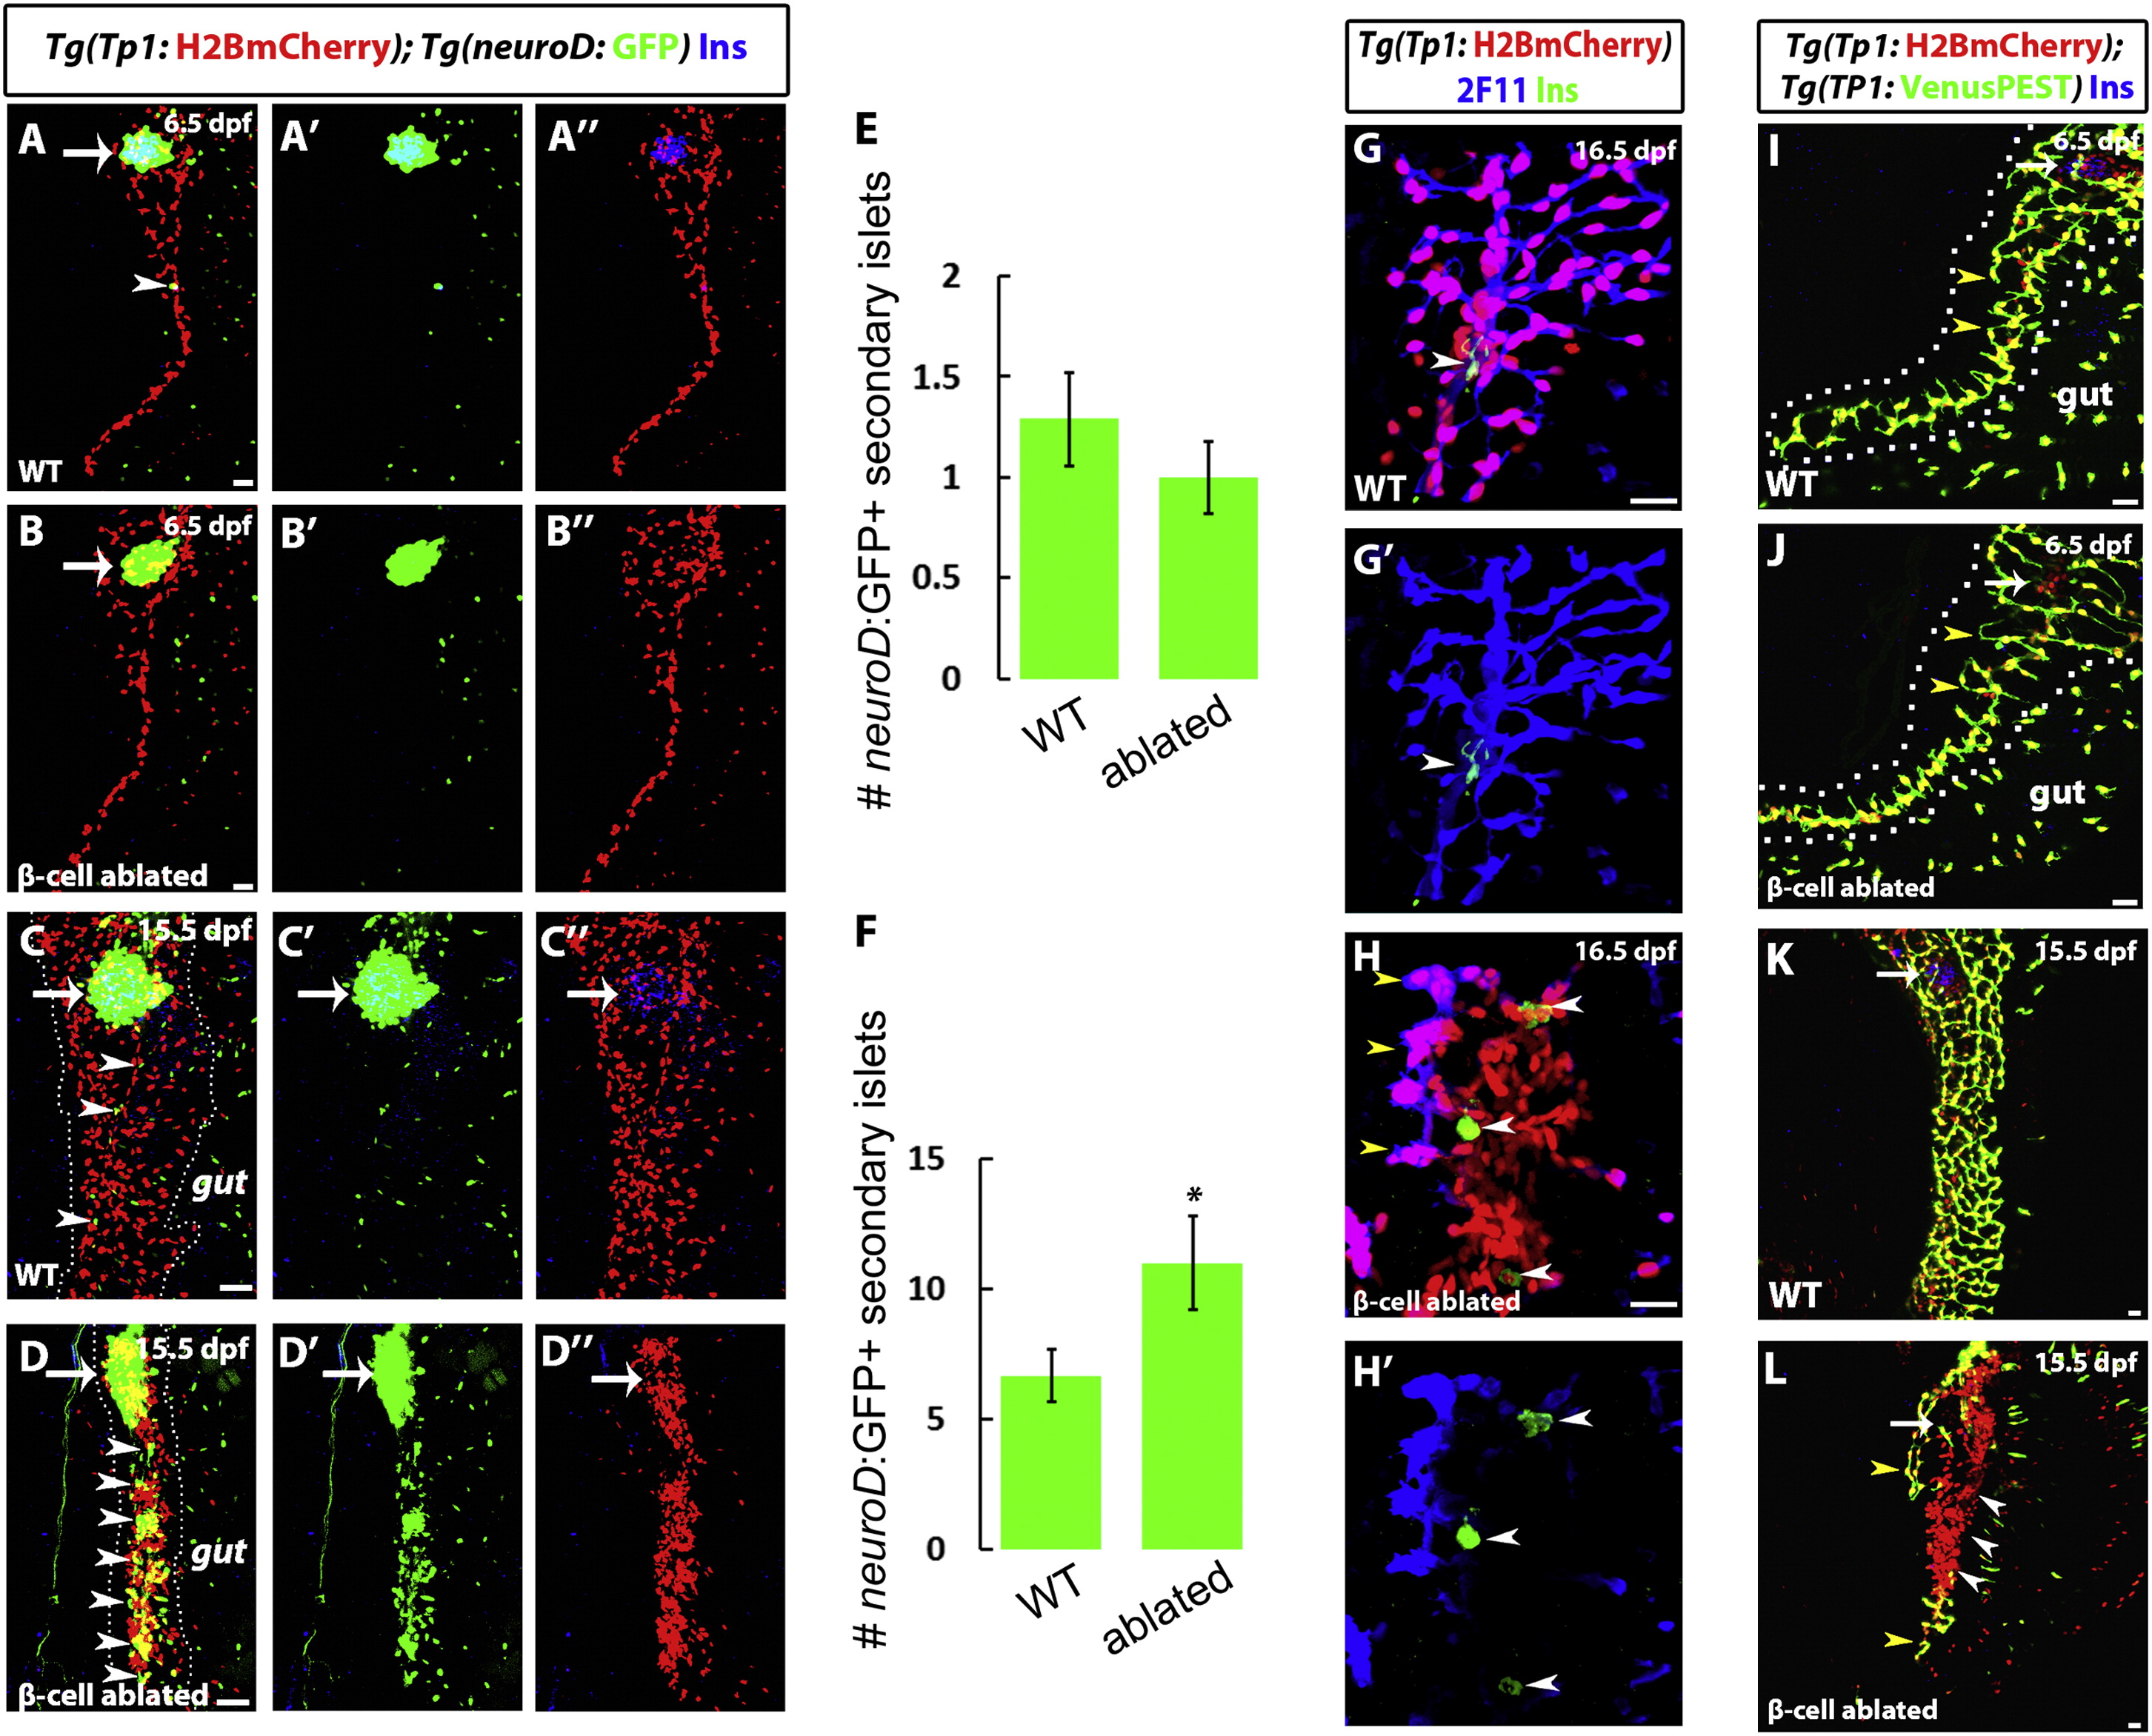
Fig. 3
β Cell Ablation Triggers a Regenerative Response in the IPD via Notch Signaling (A–D) Confocal micrographs of WT and β-cell-ablated animals at the indicated stages. β cells are marked by insulin immunoreactivity (blue). Tg(TP1:H2BmCherry) expression labels pancreatic NRCs in the IPD, and Tg(neuroD:GFP) expression marks endocrine cells and their direct precursors. Arrows point to the PI, and arrowheads point to SIs. (A and B) At 6.5 dpf and in the absence of external nutrition, the β-cell-ablated animals (B) do not exhibit any visible phenotype in the IPD or in the differentiation of NRCs into endocrine cells in comparison to WT animals (A) (n = >30 animals each). (C and D) Confocal micrographs of WT and β-cell-ablated animals at 15.5 dpf under external nutrition. At this stage, in WT animals (C), the pancreatic NRCs have expanded in numbers, and their nuclei are clearly separated. In contrast, β-cell-ablated animals exhibit a dramatic clustering of the NRCs as well as an increase in the number of SIs composed of Tg(neuroD:GFP)+ cells. (E) Quantification of the number of SIs for WT (n = 24) and β-cell-ablated (n = 33) animals at 6.5 dpf. (F) Quantification of the number of SIs for WT (n = 12) and β-cell-ablated (n = 34) animals at 16.5 dpf. Overall, β-cell-ablated animals exhibit a significant increase in the number of SIs (p = 0.014) in comparison to WT animals. (G and H) Confocal micrographs of the pancreatic tails of WT (G) and β-cell-ablated animals (H) at 16.5 dpf. β cells are marked by insulin immunoreactivity (green). 2F11 immunoreactivity (blue) marks IPD cells. Whereas, in WT animals, the vast majority of Tg(TP1:H2BmCherry)+ NRCs exhibit 2F11 immunoreactivity and form part of the ductal network, in β-cell-ablated animals, a large proportion of the Tg(TP1:H2BmCherry)+ NRCs have lost 2F11 immunoreactivity as well as ductal organization. Some of these NRCs exhibit insulin immunoreactivity (white arrowheads), indicating an attempted β cell regeneration. Only a few of the Tg(TP1:H2BmCherry)+ cells maintain high 2F11 immunoreactivity (yellow arrowheads). (I–L) Tg(TP1:VenusPEST), which expresses a fluorescent protein with a short half-life under a Notch-responsive element (TP1), was used to determine the levels of Notch signaling in WT and β-cell-ablated animals at the indicated stages. Arrows point to the PI. (I and J) At 6.5 dpf, in both WT (I) and β-cell-ablated (J) animals, the IPD cells maintain active Notch signaling and are double positive for Tg(TP1:H2BmCherry) and Tg(TP1:VenusPEST) expression. Note that, in both cases, the IPD cells exhibit branching morphogenesis (yellow arrowheads). (K and L) At 15.5 dpf, in contrast to WT animals (K) where a majority of IPD cells maintain active Notch signaling, β-cell-ablated animals (L) exhibit a strong reduction in, and even a loss of, Notch signaling in the IPD, as indicated by the presence of numerous Tg(TP1:H2BmCherry)+ but Tg(TP1:VenusPEST) cells (white arrowheads). Only some cells with active Notch signaling are present (yellow arrowheads). All panels show lateral views, anterior to the top and dorsal to the left. Error bars represent SEM, and scale bars represent 20 μm. See also Figure S3.