
|
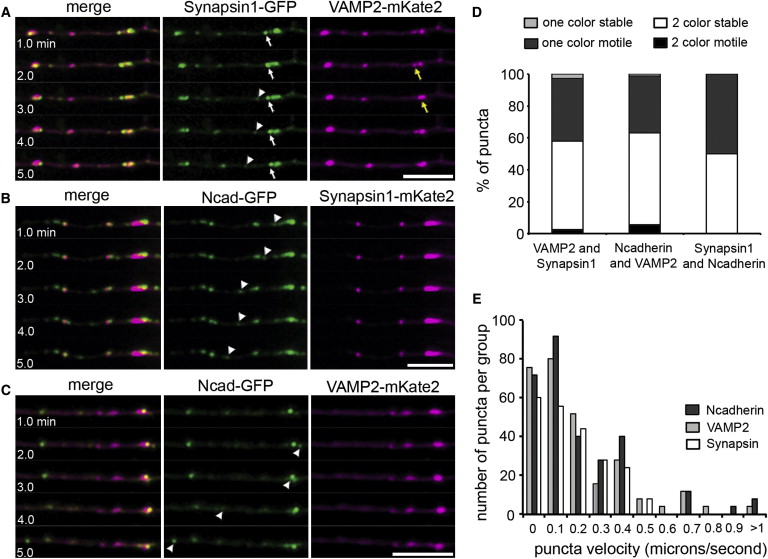
Fig. 4 Synapsin1, STVs, and PTVs Are Transported Independently of Each Other (A–C) Selected sequence of five frames, 1 min apart, from 30 min time-lapse movies showing differential transport of synapsin1-GFP and VAMP2-mKate2 (A), synapsin1-mKate2 and N-cadherin-GFP (B), and N-cadherin-GFP and VAMP2-mKate2 (C) in RB axons. Movies acquired between 24–26 hpf. Arrows and arrowheads highlight motile puncta that were positive for only one of the two fluorescent fusion proteins. A VAMP2-mKate punctum was initially paused (yellow arrow in A) and colocalized with a synapsin1-GFP punctum (white arrow), but then moved away (t = 3.0). Scale bars represent 10 μm. (D) Histogram showing the number of two color puncta versus single color puncta that are motile over a 30 min imaging period. Two color puncta are those labeled for both transport packet markers imaged in a given pair, single color puncta are those expressing only one of the two markers. Error bars represent SEM. p < 0.005.(E) Distribution of the number of each type of puncta (N-cadherin, VAMP2, synapsin) at each velocity. The maximum velocity measured for a synapsin1 puncta was 2.49- and 1.98-fold slower than the maximum velocity for an N-cadherin or a VAMP2 puncta, respectively. See also Figure S2 and Movie S2.