
|
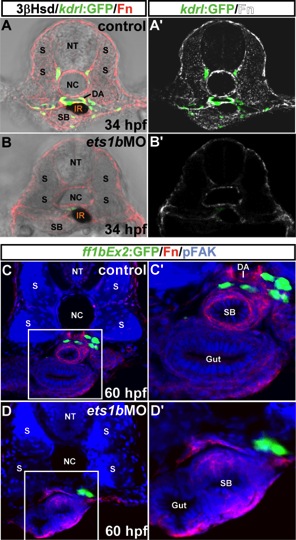
Fig. 3 The effect of ets1bMO on the Fn distribution in the interrenal region. Top: Transverse sections of Tg(kdrl:GFP)s843 embryos either uninjected (A, A′) or injected with ets1bMO (B, B′) were harvested at 34 hpf and assayed for 3β-Hsd activity (black), GFP (green), and Fn expression (red in A, B; white in A′, B′). The result of ets1b morphant in B, B′ is a representative of 9 sectioned samples, which all showed disrupted vasculature at the level of the midtrunk. Bottom: Transverse sections of Tg(ff1bEx2:GFP) embryos either uninjected (C, C′) or injected with ets1bMO (D, D′) were harvested at 60 hpf and assayed for GFP (green), Fn expression (red), and pFAK (blue). C′, D′ are magnified views of the outlined areas in C, D. The result of ets1b morphant in D, D′ is a representative of 20 sectioned samples. The accumulation of Fn in the interrenal microenvironment is severely reduced in the ets1b morphant. All sections are oriented with the dorsal side toward the top. DA, dorsal aorta; IR, interrenal tissue; NC, notochord; NT, neural tube; S, somite; SB, swim bladder.