
|
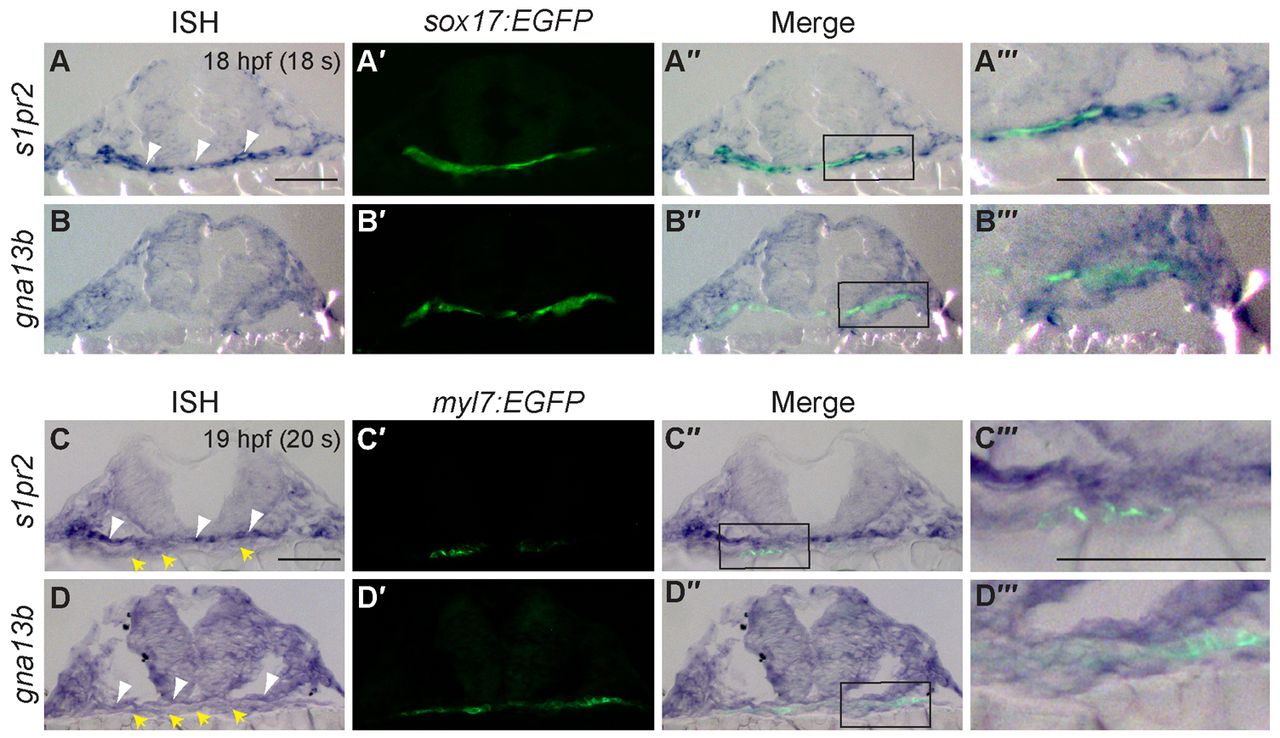
Fig. 4 s1pr2 and gna13 are expressed in the endoderm and cardiomyocytes during segmentation. (A-D′) Transverse sections of Tg(sox17:EGFP) (A,B) and Tg(myl7:EGFP) (C,D) embryos at 18- and 20-somite stages. Shown are s1pr2 (A-A′′′,C-C′′′) and gna13a (B-B′′′,D-D′′′) transcript, as detected by in situ hybridization (A-D), and EGFP expression in endodermal cells (A′,B′) and cardiomyocytes (C′,D′) as detected by immunofluorescence staining (anti-GFP antibody). (A′′-D′′) Merged images of A-D and A′-D′. (A′′′-D′′′) High-magnification images of the boxed regions in A′′-D′′. Yellow arrows, endoderm; white arrowheads, cardiomyocytes. Scale bars: 100 μm.