
Image
|
Figure Caption
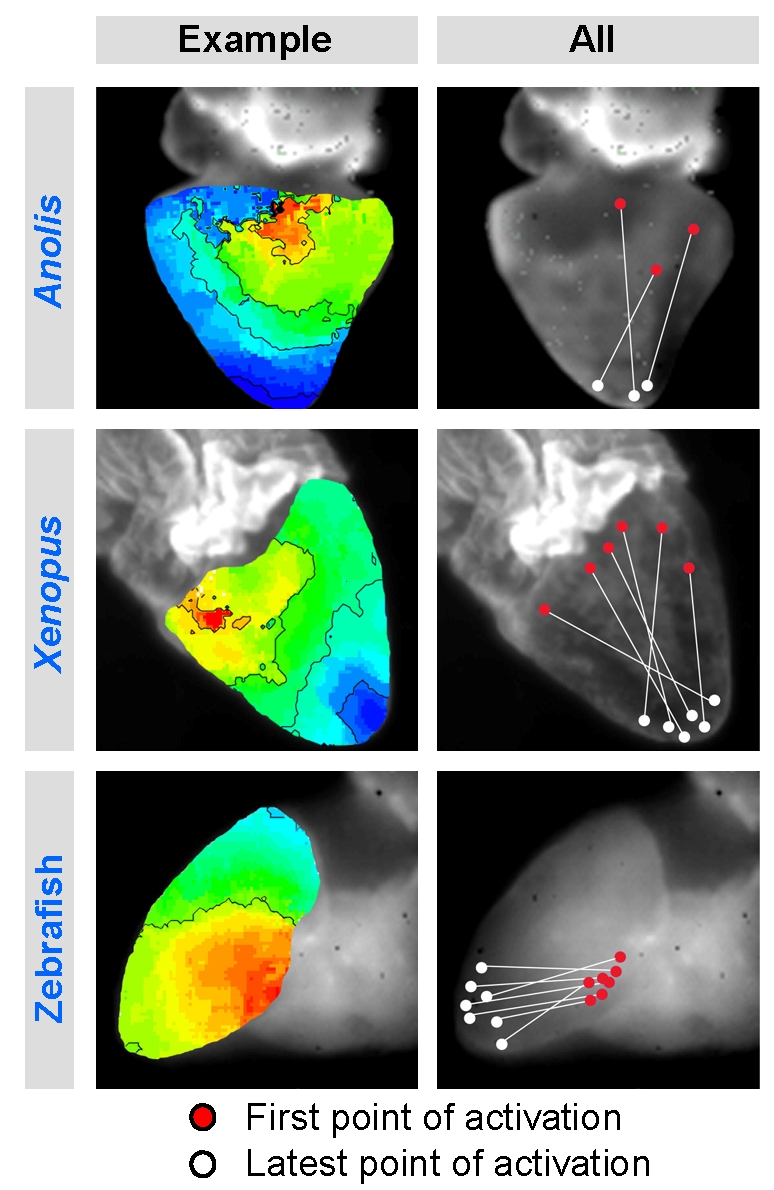
Fig. S5
Summary of individual ventricular activation maps. Red marks the earliest epicardial breakthrough of the activation front which was consistently at the ventricular base. Earliest and latest activation (red and white dots respectively) from each specimen is projected onto one specimen.
Acknowledgments
This image is the copyrighted work of the attributed author or publisher, and
ZFIN has permission only to display this image to its users.
Additional permissions should be obtained from the applicable author or publisher of the image.
Full text @ PLoS One