
|
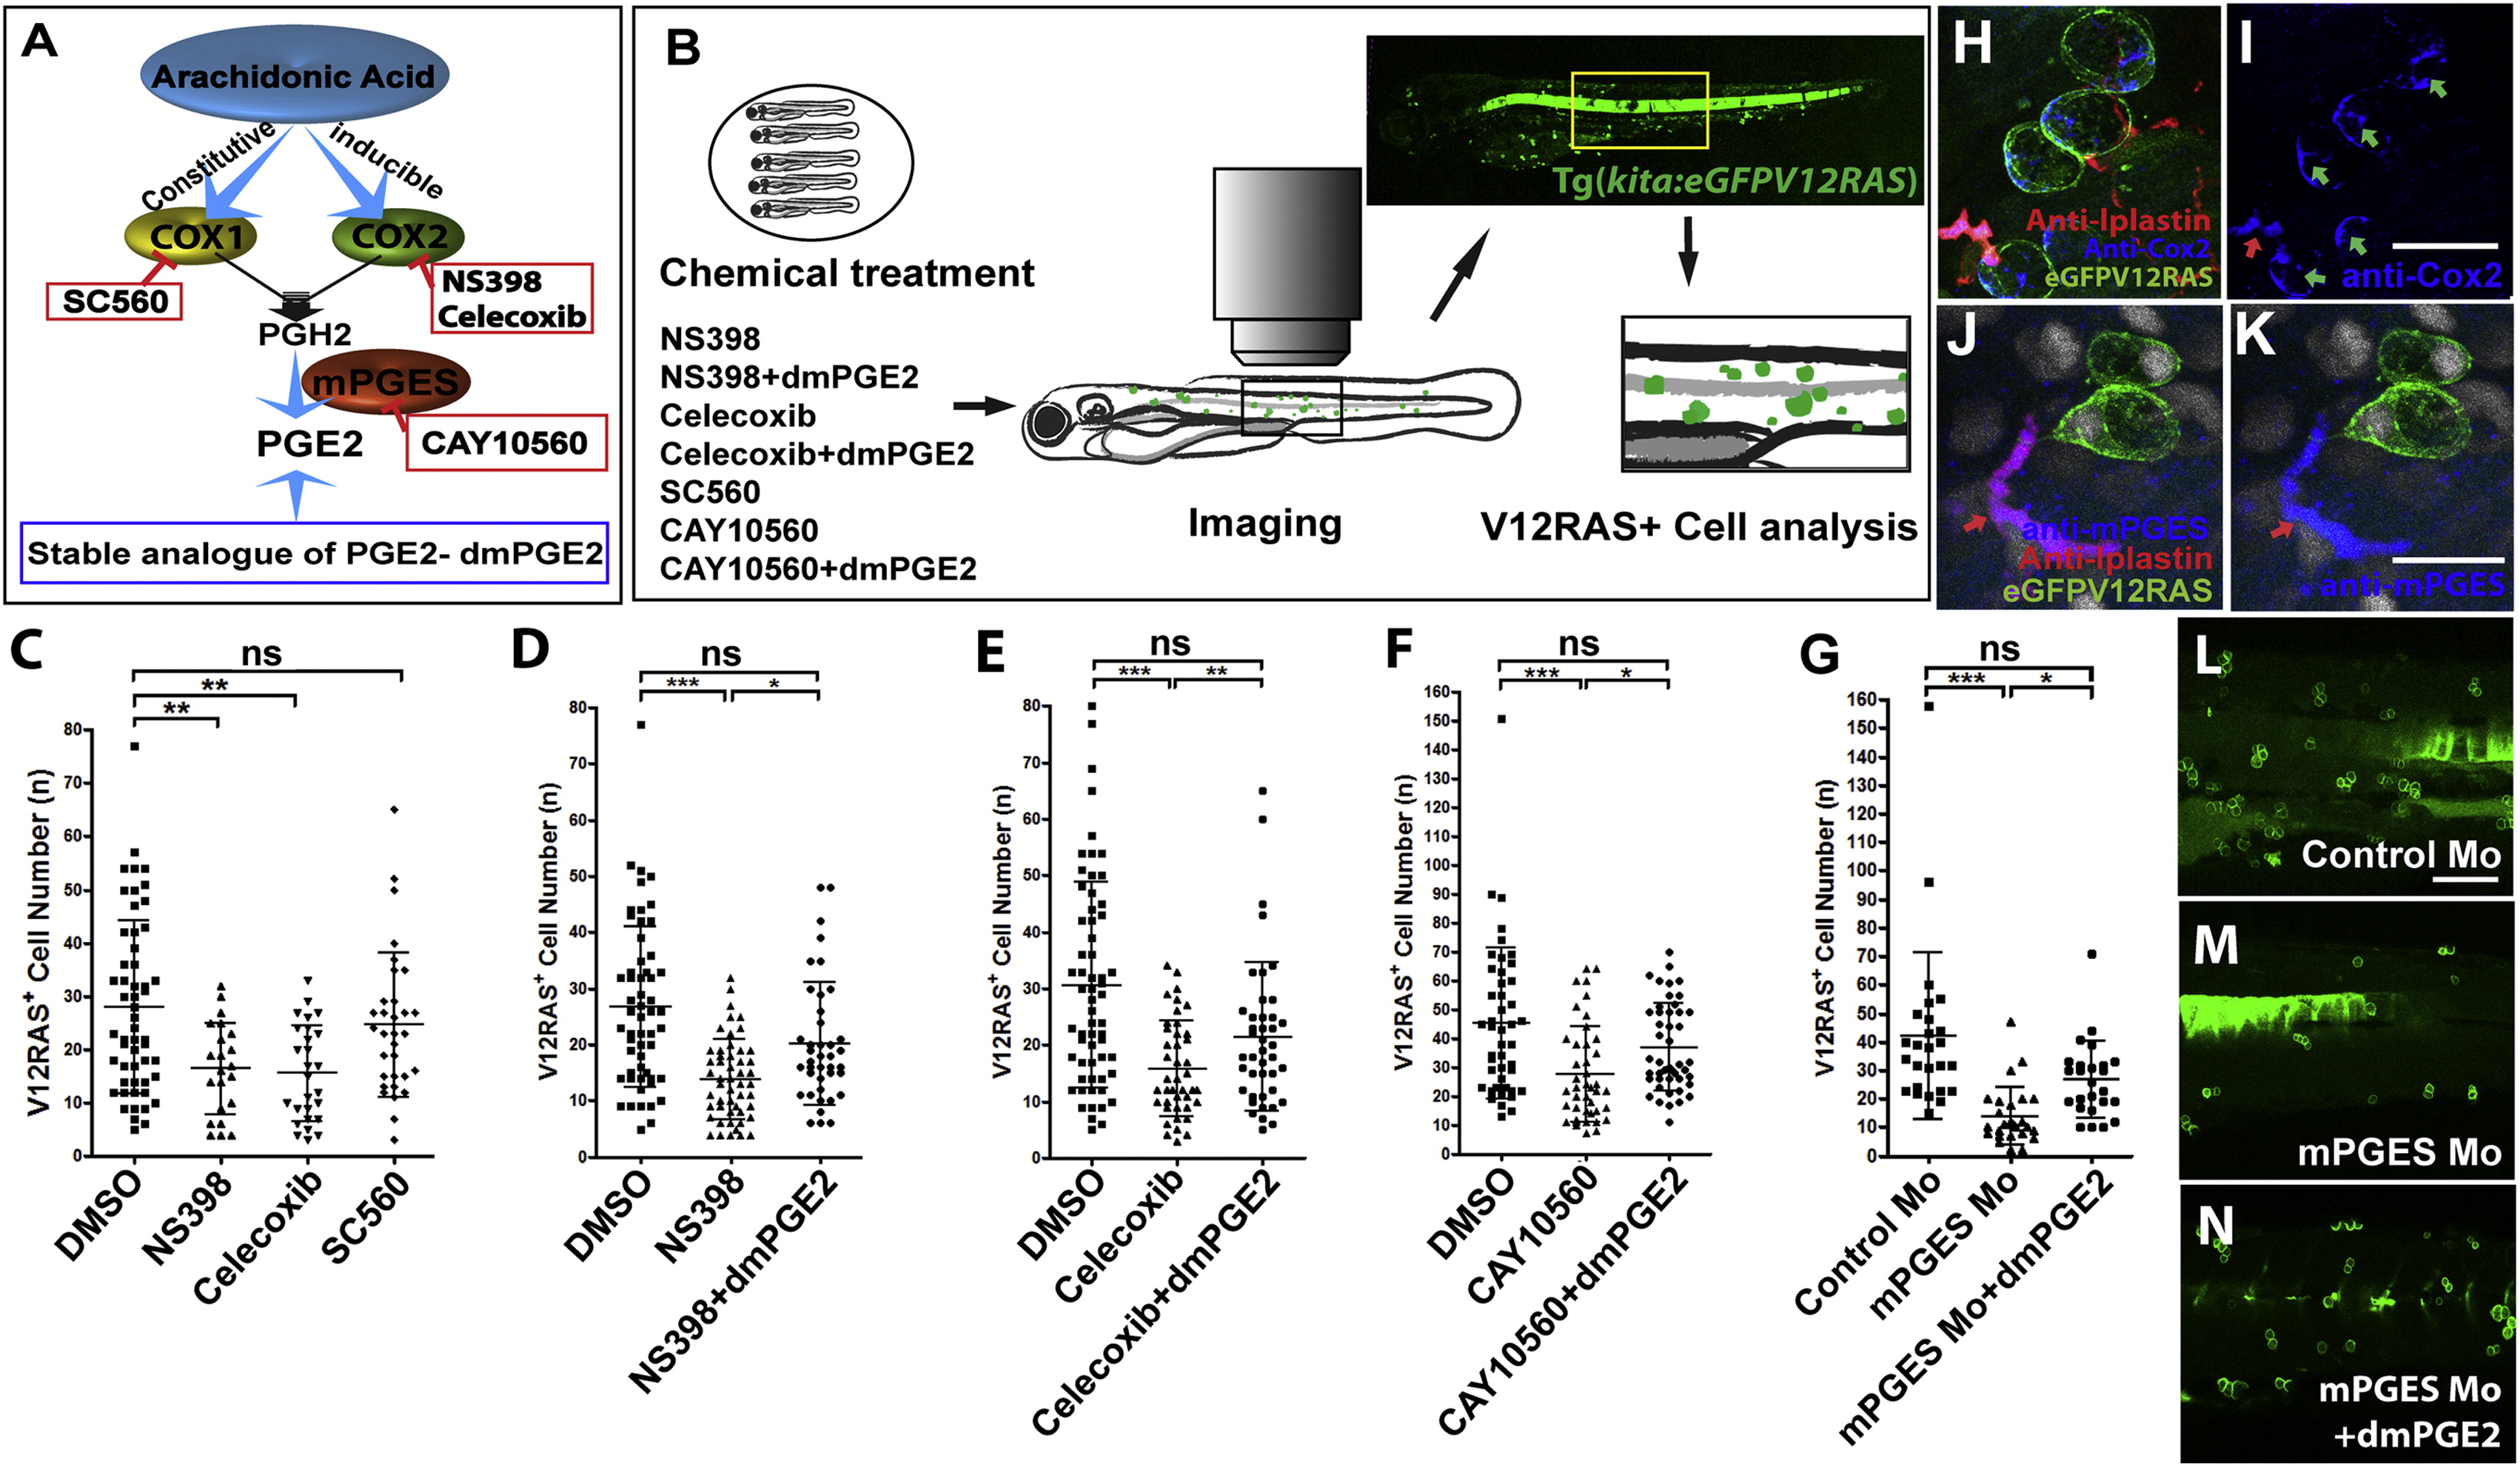
Fig. 1 Blocking COX-2-mPGES-Mediated PGE2 Production Suppresses the Growth of V12RAS+ Transformed Cells In Vivo(A) A schematic representation of PGE2 production through the COX-2 pathway indicates the targets and inhibitors used in this study.(B) A schematic representation of our pharmacological treatment regime and clonal analysis of transformed cells (green) in V12RAS+-cell-bearing larvae. A yellow box indicates the flank skin region in which we quantified alterations in growth of V12RAS+ cells.(C–G) Graphic comparisons of V12RAS+ cell numbers in larval flank skin region after various treatments; (C) larvae treated with DMSO, COX-1 inhibitor, SC-560, and the COX-2 inhibitors NS398 and Celecoxib (p < 0.01, n = 22, 27, and 32, respectively); (D) larvae treated with DMSO, NS398, and NS398 +dmPGE2 (p < 0.001, n = 56, 51, and 40, respectively); (E) larvae treated with DMSO, Celecoxib, and Celecoxib +dmPGE2 (p < 0.001, n = 61, 42, and 42, respectively); (F) larvae treated with DMSO, CAY10560 and CAY10560 +dmPGE2 (p < 0.001, n = 45, 42, and 46, respectively); (G) Control morphants, mPGES morphants, and mPGES morphants rescued with dmPGE2 (p < 0.001, n = 26, 25, and 25, respectively).(H) Immunostaining for COX-2 (blue) indicates that both leukocytes (anti-L-plastin [red]) and V12RASeGFP+ transformed cells (green) express COX-2.(I) Single-channel image of (H), better showing COX-2 expression; green and red arrows indicate transformed cells and leukocytes, respectively.(J) Immunostaining for mPGES (blue) indicates its expression by some leukocytes (anti-L-plastin; red arrow) but not transformed cells (green).(K) Single-channel image of (J).(L–N) Representative images of flank skin regions showing V12RAS+ clones (green) of (L) control morphant, (M) mPGES morphant, and (N) mPGES morphant supplemented with dmPGE2- Scale bars represent 20 μm (H and I), 15 μm (J and K), and 100 μm (L–N). See also Figures S1, S2, and S3.