
|
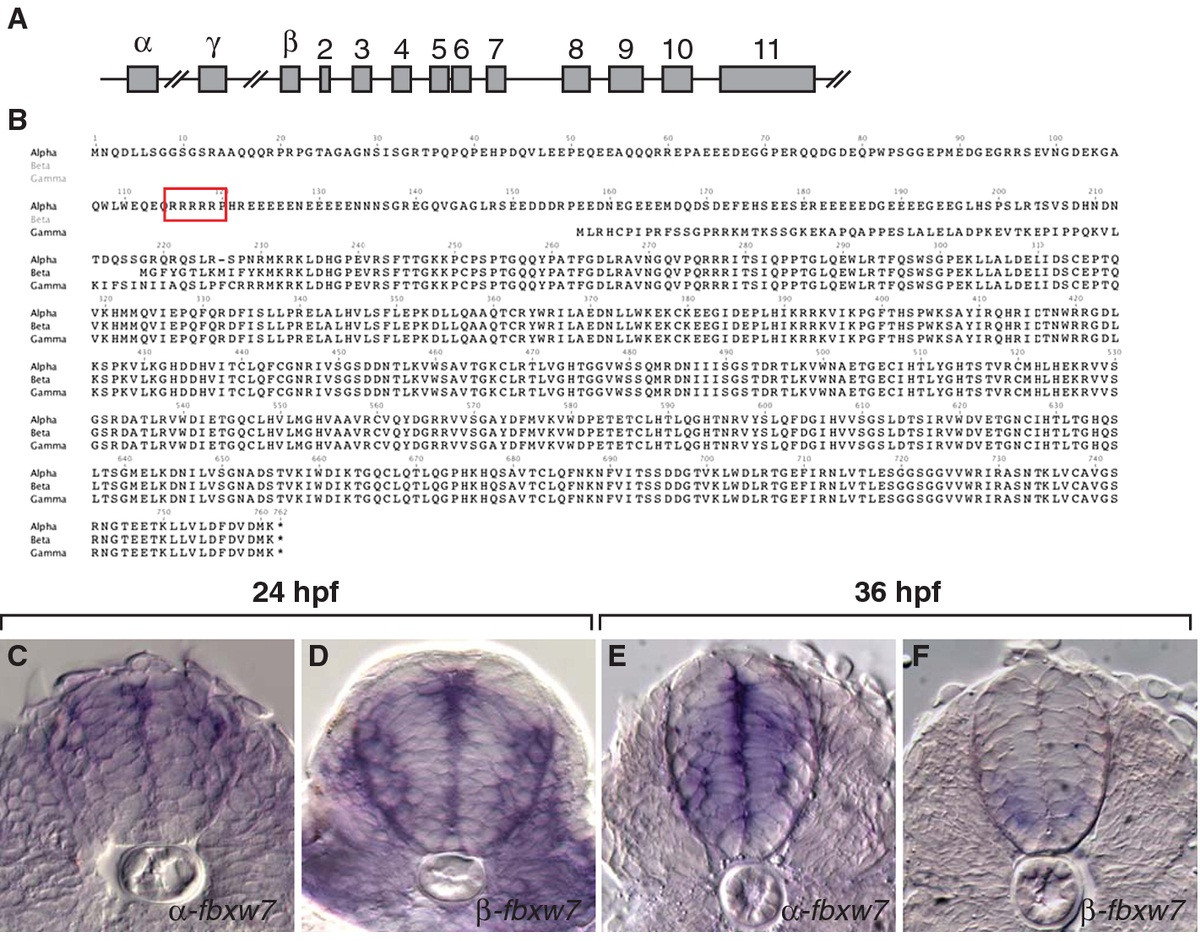
Fig. 3
fbxw7 gene structure and expression. (A) Schematic representation of fbxw7 gene structure. Three alternative first exons, α, γ, and β, are spliced to exons 2–11. (B) Predicted amino acid sequences of Fbxw7 isoforms. The putative nuclear localization sequence of the α isoform is boxed. (C-F) Transverse sections through the level of the trunk spinal cord showing α and β-specific RNA expression detected by in situ hybridization. At 36 hpf, when pMN precursors initiate OPC formation, medial spinal cord cells α-fbxw7 at relatively high level whereas β-fbxw7 transcripts are only evident at low level in ventral spinal cord.