
|
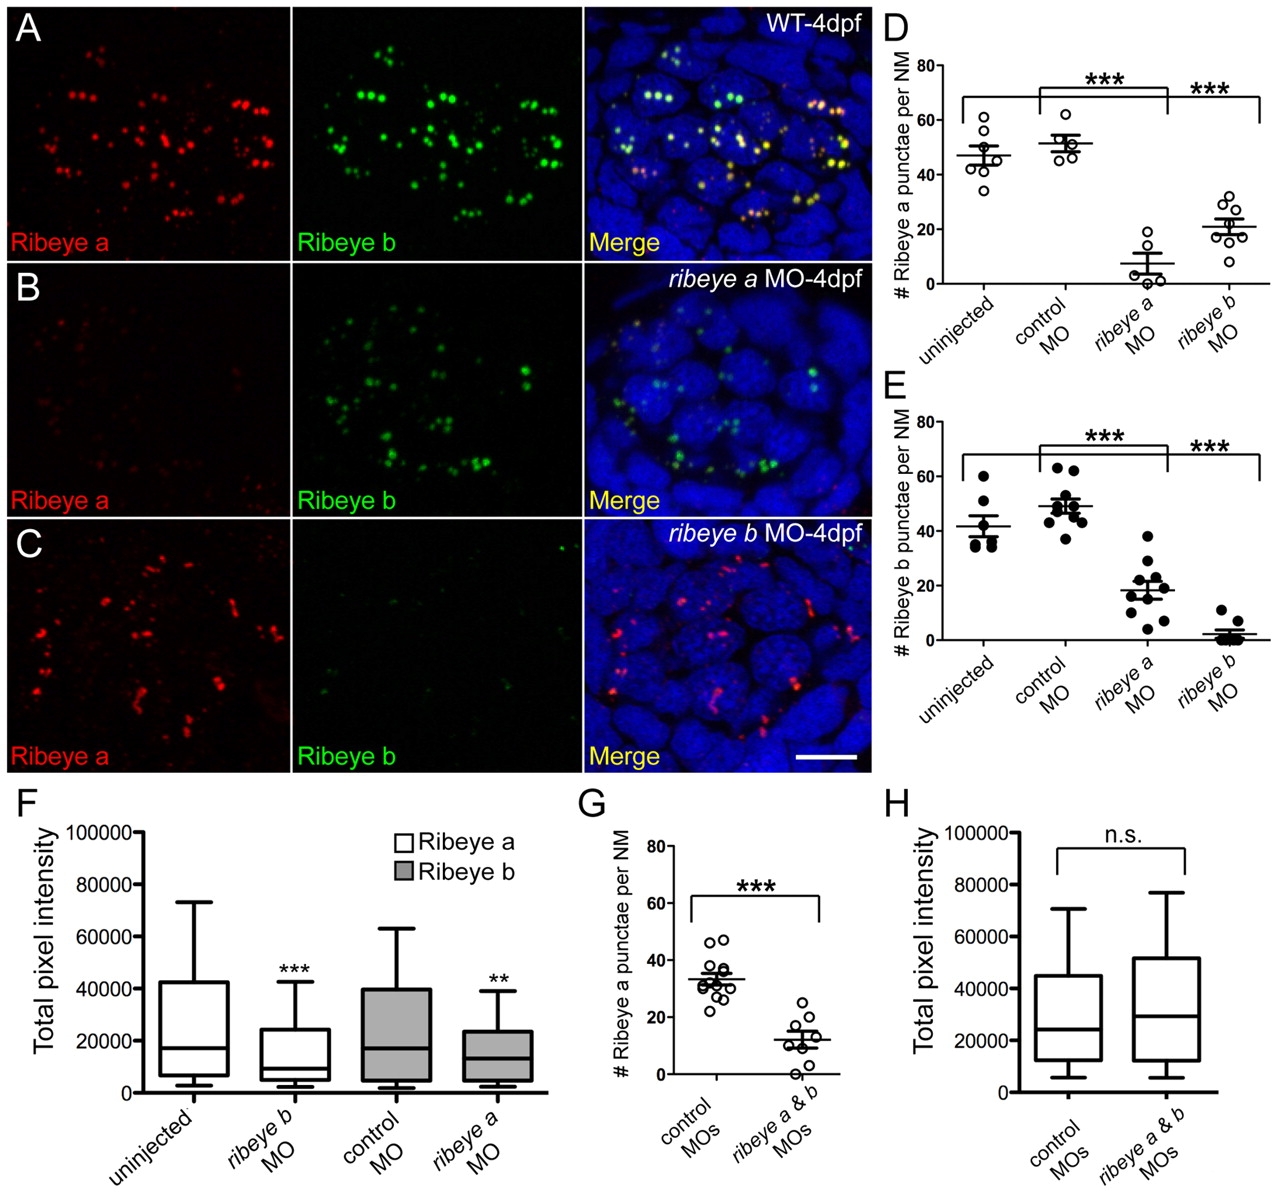
Fig. 3
Morpholino-mediated knockdown of ribeye a and ribeye b in 4-day-old zebrafish larvae. (A-C) Representative confocal z-projections of Ribeye a (red) and Ribeye b (green) immunolabel in neuromast hair cells of wild-type (A), ribeye a morphant (B) and ribeye b morphant larvae (C). Merged images include DAPI (blue). Scale bar: 3 µm. (D) The average number of Ribeye a punctae per neuromast in wild-type (47±4, n=7), control MO-injected (51±7, n=5) and ribeye a (7±4, n=5) or ribeye b (21±3, n=8) antisense MO-injected larvae. Each circle represents neuromast 2 in an individual larva. (E) The average number of Ribeye b punctae per neuromast in wild-type (42±4, n=7), control MO-injected (49±3, n=10), and ribeye a (18±3, n=10) or ribeye b (2±2, n=8) antisense MO-injected larvae. (F) Total pixel intensity (A.U.) of Ribeye a immunolabeled punctae in wild-type and ribeye b morphant larvae, and Ribeye b in control and ribeye a morphants. (Mann-Whitney U-test: P<0.0001 and P<0.003, respectively). (G) The average number of Ribeye a punctae per neuromast in ribeye a and ribeye b control (33±2, n=9) or antisense (12±3, n=8) MO-injected larvae. (H) Total pixel intensity of Ribeye a punctae in control and in a ribeye a and ribeye b morphant (Mann-Whitney U-test; P=0.23). Error bars indicate s.e.m. in D,E,G. Whiskers indicate the 10th and 90th percentiles in F and H.