
|
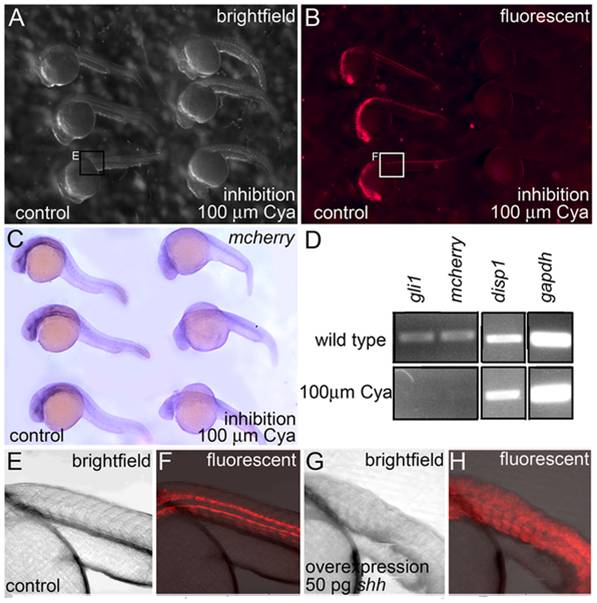
Fig. 4 Reporter expression in Tg(Gli-d:mCherry) fish is sensitive to the Hh-signaling pathway.
(A–C) Lateral views, anterior to the left, of 30 hpf ethanol vehicle treated controls (left side of image) and Cya treated (right side) Tg(Gli-d:mCherry) siblings. (A,B) Live embryos were visualized using brightfield (A) and fluorescence (B) microscopy. 100 &mu:m Cya treated embryos showed a significant reduction in fluorescent mCherry protein when compared to their ethanol vehicle treated siblings. (C) Fixed embryos, stained with mCherry riboprobe revealed that 100 μm Cya treated embryos displayed significantly reduced mCherry RNA transcripts compared to their vehicle-treated siblings. (D) RT-PCR showing reduced gli1, and mCherry expression in 30 hpf embryos treated with 100 μm Cya compared to their nontreated (NT) siblings. Two loading controls for disp1 and gapdh were included. (E–H) Lateral views of 30 hpf noninjected controls (E,F) or Tg(Gli-d:mcherry) siblings injected with 50 pg shh at the one cell stage (G,H). Siblings injected with shh mRNA showed expanded reporter expression throughout the trunk when compared to noninjected controls.