
|
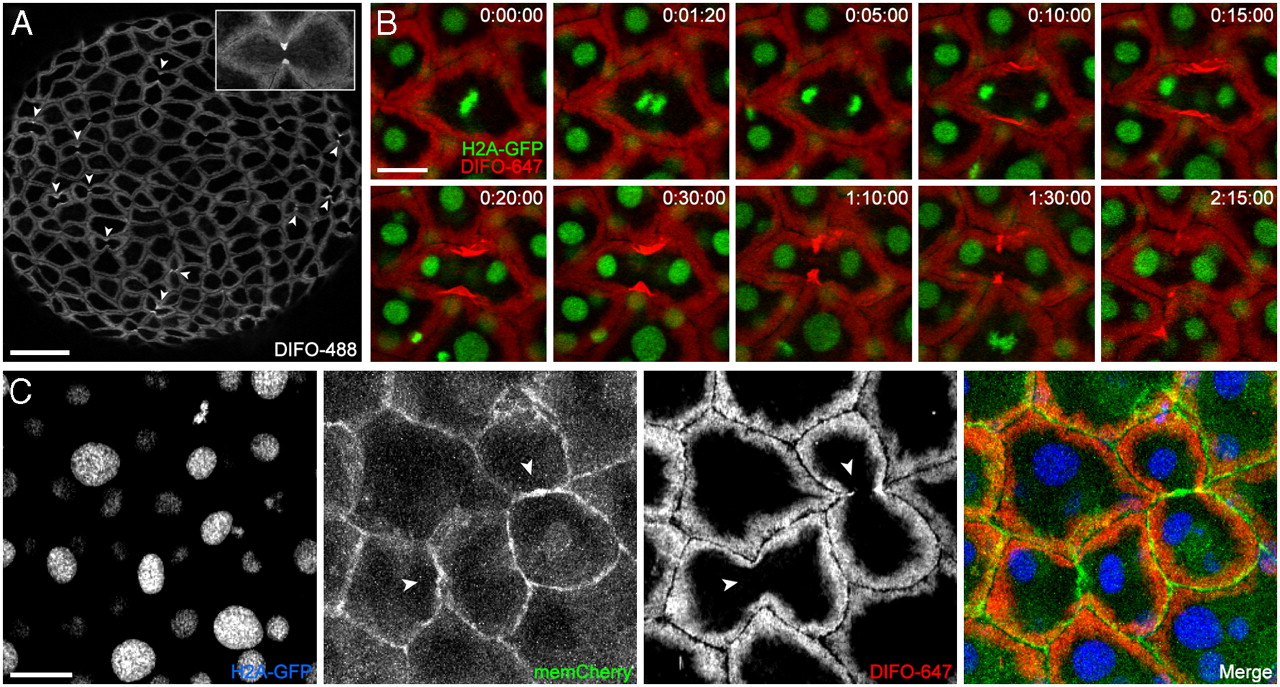
Fig. 5
Time-lapse monitoring of mitotic cells reveals dramatic glycan reorganization during cell division. (A) Wild-type zebrafish embryos were microinjected with GalNAz, allowed to develop to 10 hpf, reacted with DIFO-488 (100 μM, 1 h), and imaged by confocal microscopy. Arrowheads indicate intense staining at the cleavage furrow of dividing cells. Maximum intensity z-projection images are shown. (B) H2A-GFP transgenic zebrafish embryos were microinjected with GalNAz and allowed to develop to 10 hpf. The embryos were reacted with DIFO-647 (100 μM, 1 h) and imaged by confocal microscopy. Shown are single z-plane frames from a time-lapse movie (S1). Indicated in the top right corner of each image is time (h:min:s). Green, H2A-GFP; red, DIFO-647. (C) H2A-GFP zebrafish were microinjected at the one-cell stage with GalNAz and memCherry mRNA and allowed to develop to 10 hpf. The embryos were reacted with DIFO-647 (100 μM, 1 h) and imaged by confocal microscopy. Blue, H2A-GFP; green, memCherry; red, DIFO-647. Arrowheads indicate location of new membrane between daughter cells. Maximum intensity z-projection images are shown. [Scale bars: 100 μm (A), 20 μm (B, C).]