
Fig. 1
|
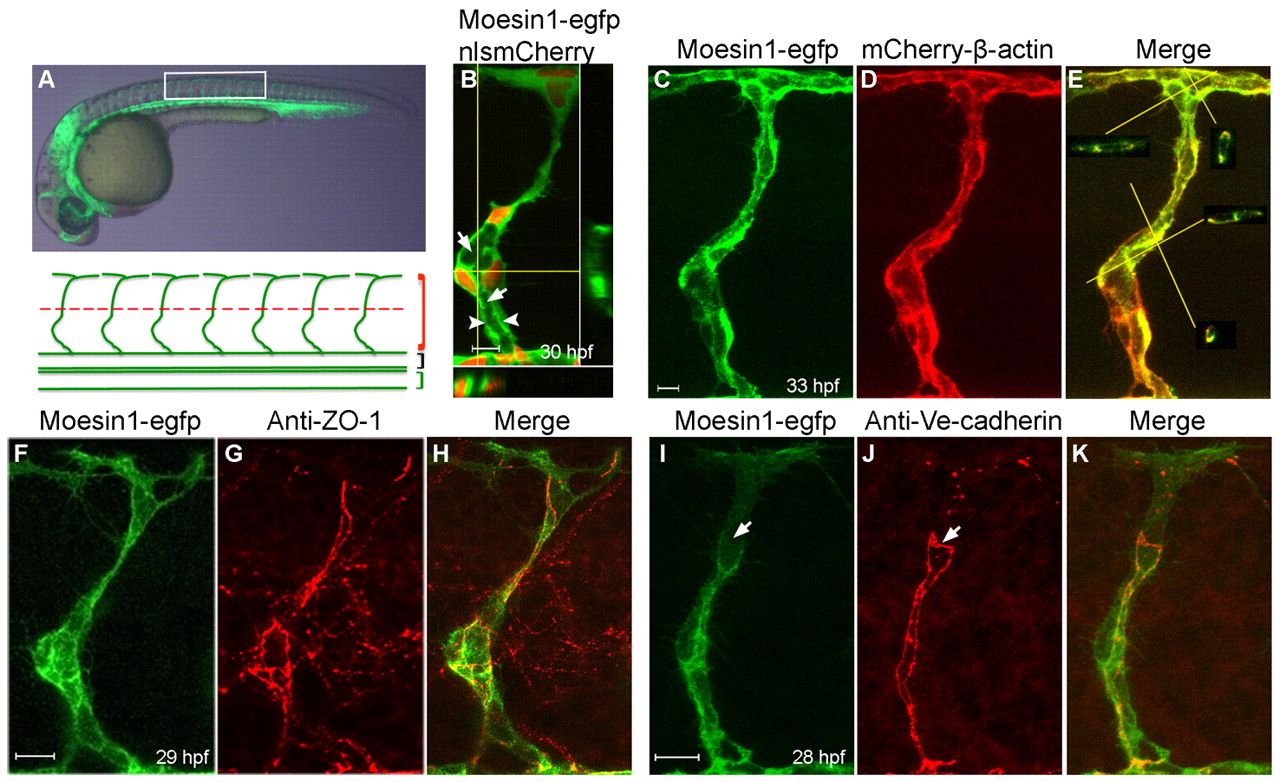
Fig. 1 Moesin1-EGFP and mCherry-β-Actin fusion proteins are enriched at apical membranes and cellular junctions. (A) A 30 hpf zebrafish embryo from Tg(flk1:moesin1-egfp) with the box indicating the area shown beneath. Red, black and green brackets indicate the intersegmental vessels (ISVs), dorsal aorta (DA) and posterior caudal vein (PCV), respectively. The red dashed line designates the boundary between the dorsal (top) or ventral (bottom) ISVs. (B) An ISV in a Tg(flk1:moesin1-egfp)/Tg(flk1:nlsmCherry) embryo showing the primary lumen (arrows) forming at 30 hpf. Moesin1-EGFP is enriched at the apical membrane (arrowheads). The nuclei are in red. Virtual cross-sections are at the bottom and to the right of the main panel. Yellow lines designate the planes of the cross-sections. (C-E)A Tg(flk1:moesin1-egfp)/Tg(flk1:mCherry-β-actin) embryo at 33 hpf displayed considerable overlap of fluorescence in the ISV. Virtual cross-sections in E show the lumen. (F-H) Moesin1-EGFP and the tight junction protein ZO-1 co-localized at 29 hpf. (I-K) At 28 hpf, Moesin1-EGFP is enriched at adherens junctions, as labeled with anti-Ve-cadherin antibody, although not always (arrows). (A-K) Lateral images, dorsal is up, anterior is to the left. Scale bars: 10 μm in all figures.