
|
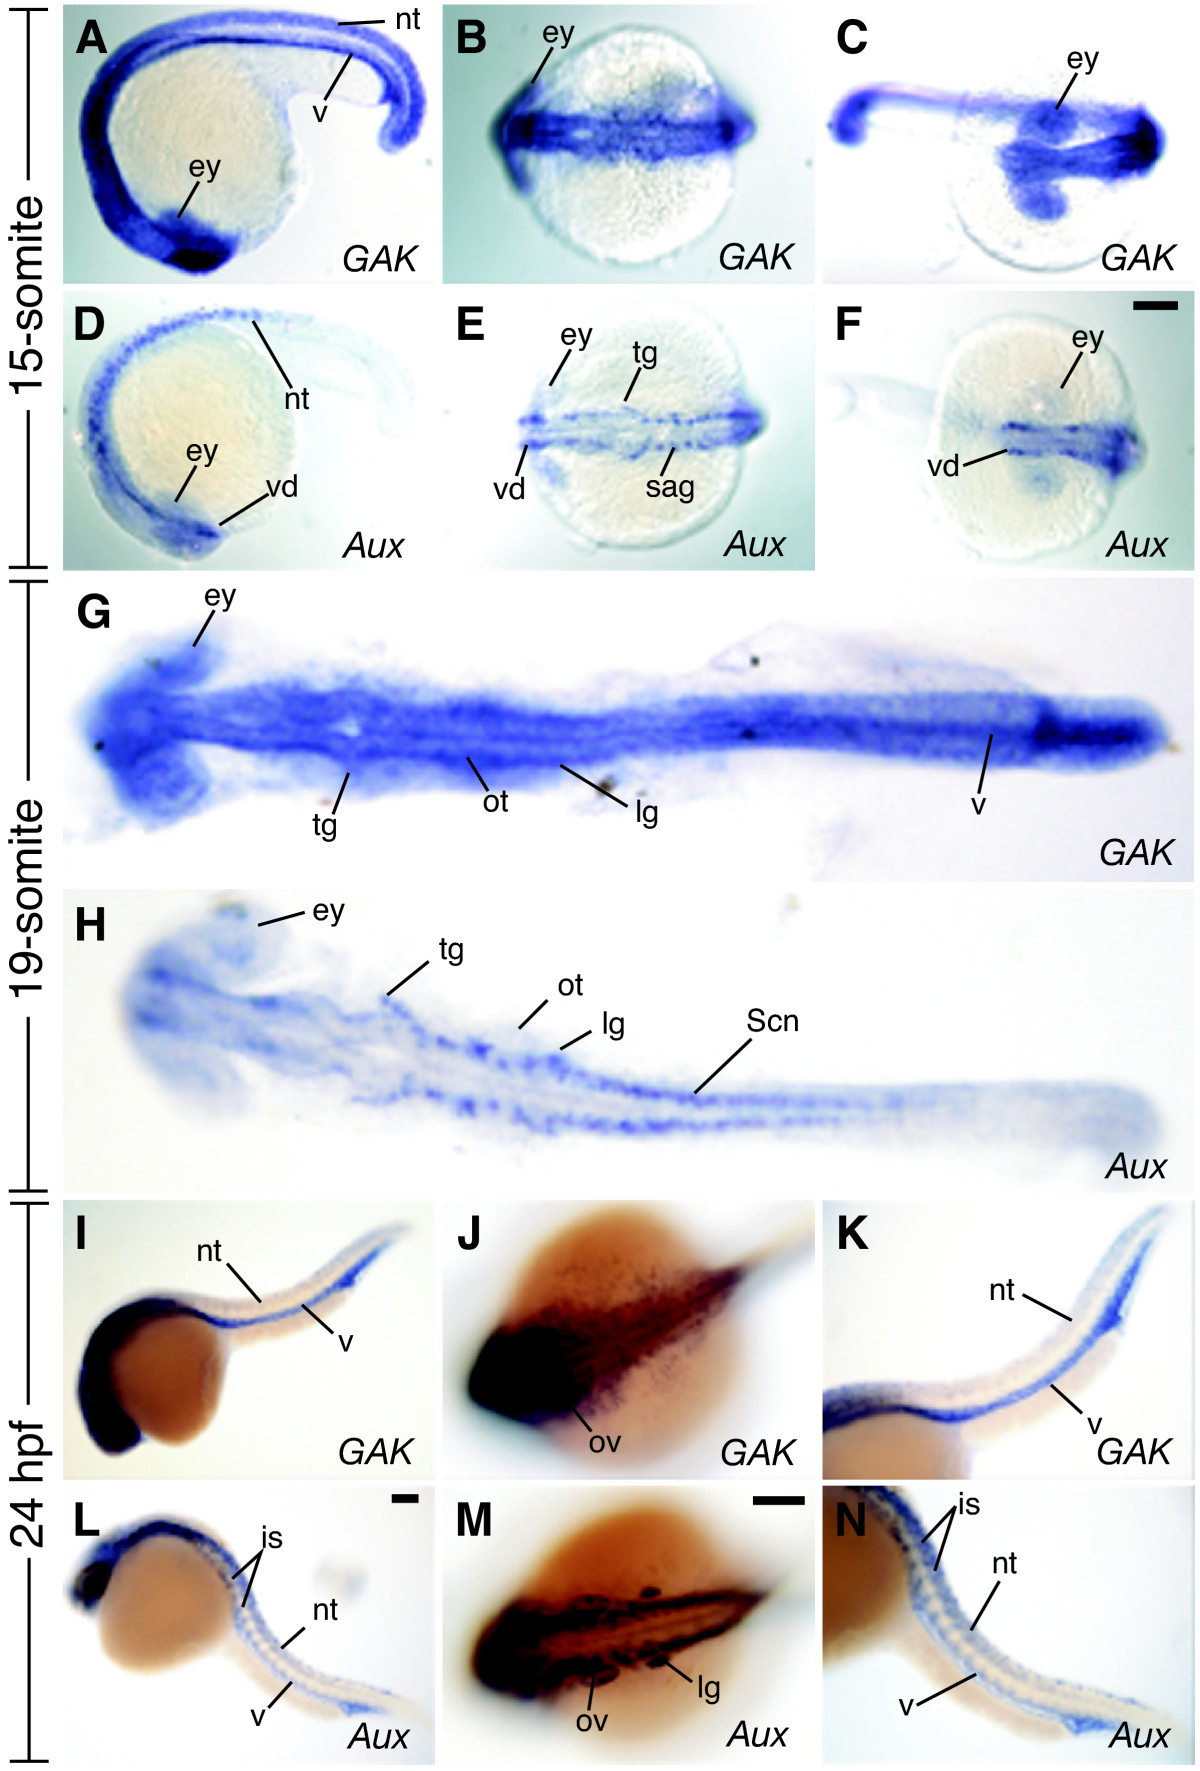
Fig. 5 The expression patterns of GAK and auxilin during zebrafish embryonic development. (A, D) Lateral, (B, E) dorsal, and (C, F) anterior views of wild-type embryos at the 15-somite stage. (A-C) zGAK is expressed broadly in the hindbrain (B), forebrain and eyes (C). (D-F) zAux is expressed mostly in neural tissues as described in the main text. (G, H) Dorsal views of 19-somite stage embryos. (G) zGAK is still ubiquitously expressed and (H) zAux remains specific to bilateral stripes of neural cells. (I, K, L, N) Lateral and (J, M) dorsal views of 24 hpf embryos. (I-K) zGAK is seen in the brain, vasculature and otic vesicles. (L-N) zAux remains concentrated in bilateral stripes of neural cells. Panels K and N are close-up views of the posterior regions of the embryos shown in (I) and (L), respectively. In all the images, anterior is to the left, and in all the lateral views, dorsal is up. ey, eye; is, intersomitic vessel; lg, lateral line ganglion; nt, neural tube; ot, otocyte; ov, otic vesicle; sag, statoacoustic ganglion; Scn, Spinal cord neuron; tg, trigeminal ganglion; v, vasculature; vd, ventral diencephalon. Scale Bar, 100 μm.