
|
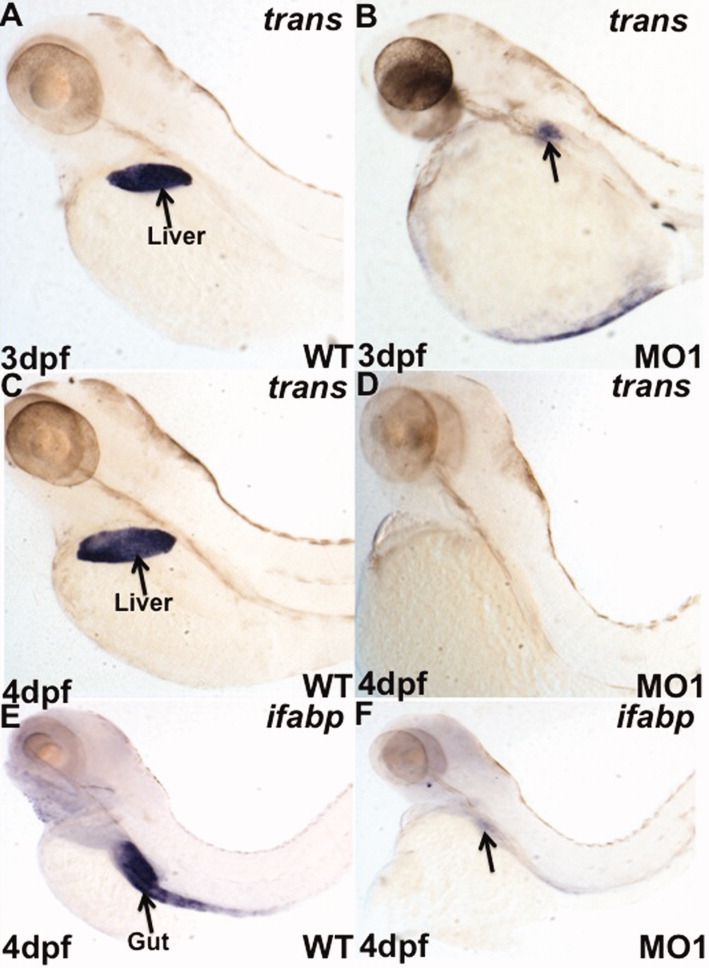
Fig. 6 Gut organogenesis fails as shown by organ-specific markers. Shown are representative embryos labeled by in situ hybridization for the liver-specific marker transferrin (A-D) at 3 dpf (A, B) or 4 dpf (C, D) comparing wildtype (WT) control embryos with morphant (MO1) embryos (B, D). At 3 dpf, there is a small patch of transferrin-positive cells (arrow in B) but this is eliminated or regressed by 4 dpf. E,F: Shown are representative embryos labeled for the gut-specific marker ifabp at 4 dpf, comparing wildtype (WT) control (E) to morphant (F). Gut tissue is barely detectable in the morphant embryos (arrow in F). All views are lateral, dorsal to the top, and anterior to the left.