
|
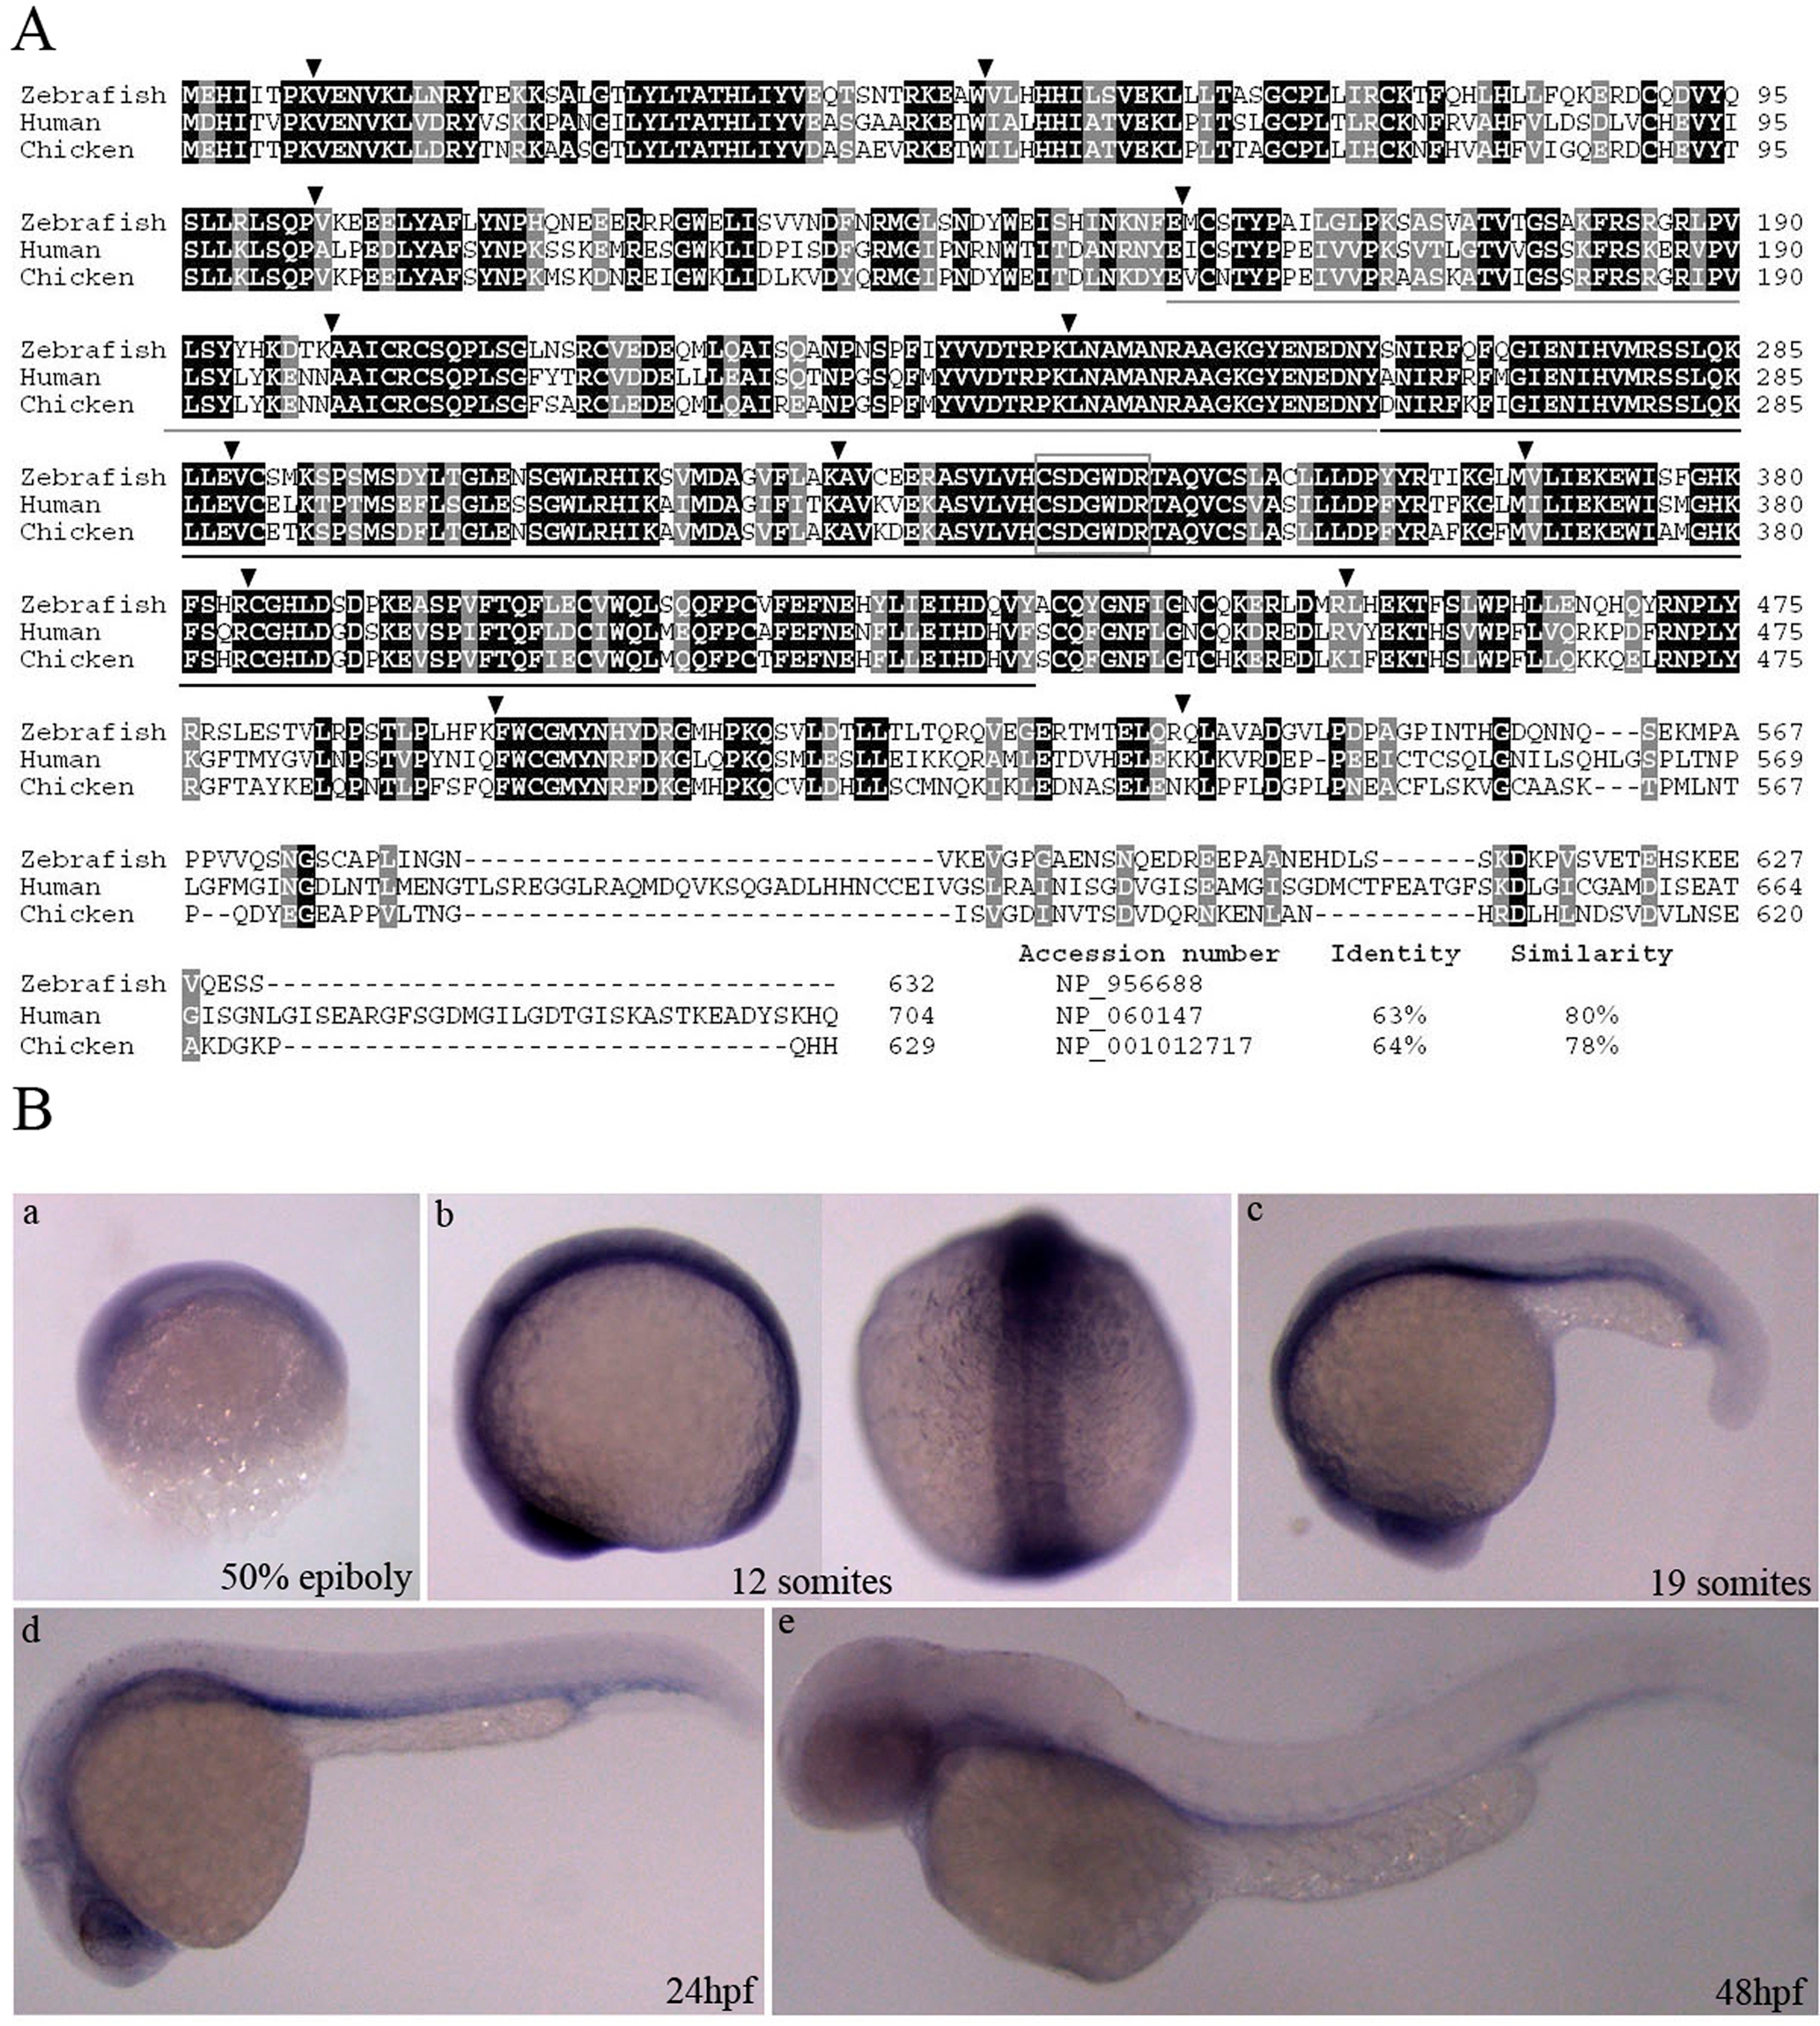
Fig. 1 Sequence comparison and expression pattern of the deduced zebrafish Mtmr8.
(A) Amino acid alignment of Mtmr8 between zebrafish with human and chicken. Similar and identical amino acids are highlighted in grey and black boxes. And the percentages of identities and similarities in Mtmr8 were shown compared zebrafish with others. Arrowheads indicate the location of introns and are flanked by the corresponding exon numbers. The region encompassing the Myotub-related and PTPc_DSPc domain is underlined in grey and black lines. The rectangular box indicates the CX5R active site motif of enzymatically active members in the MTM family. (B) Expression pattern of zebrafish Mtmr8. Whole-mount RNA in situ hybridization were performed using a Mtmr8 specific antisense riboprobe on embryos at the indicated stages. The arrows indicate the signals in the anterior and head. Embryos in panels are lateral view with the animal pole toward the top, and the right picture of panel b is dorsal view. The embryos in other panels are lateral views, with dorsal toward the top and anterior to the left. All scale bars are 100 μm.