
|
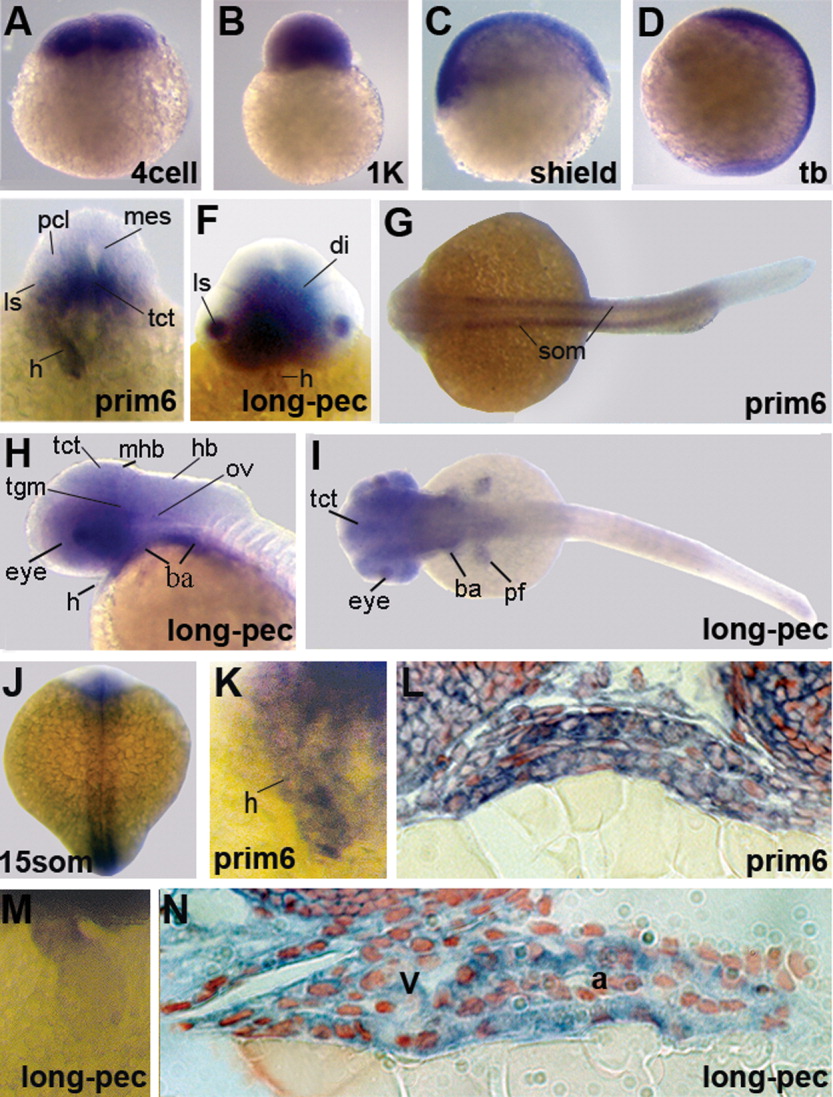
Fig. 2 Gene expression patterns of LMO7 during zebrafish development. Expression results of whole-mount in situ hybridization are shown for the seven stages indicated. A-D,G,H,J: In additional to embryos between cleavage and end of gastrulation (A-D), we present dorsal views of embryos at 15som, prim-6, and long-pec stage (G,H,J). E,F, I: A higher magnification of the dorsal view at prim-6 (F) and a lateral (I) and frontal (E) view of the head at long-pec stage are shown. K,M: Close-ups of the heart at prim-6 and long-pec stage are presented. L,N: Additionally, sections of the hearts at these stages are shown. ba, branchial arches; di, diencephalon; fp, floorplate; h, heart; hb, hindbrain; mb, midbrain; mhb, midbrain-hindbrain boundary; ls, lens; ov, otic vesicle; pf, pectoral fin buds; pcl, proliferative cell layer; tct, tectum; tegm, tegmentum.