
|
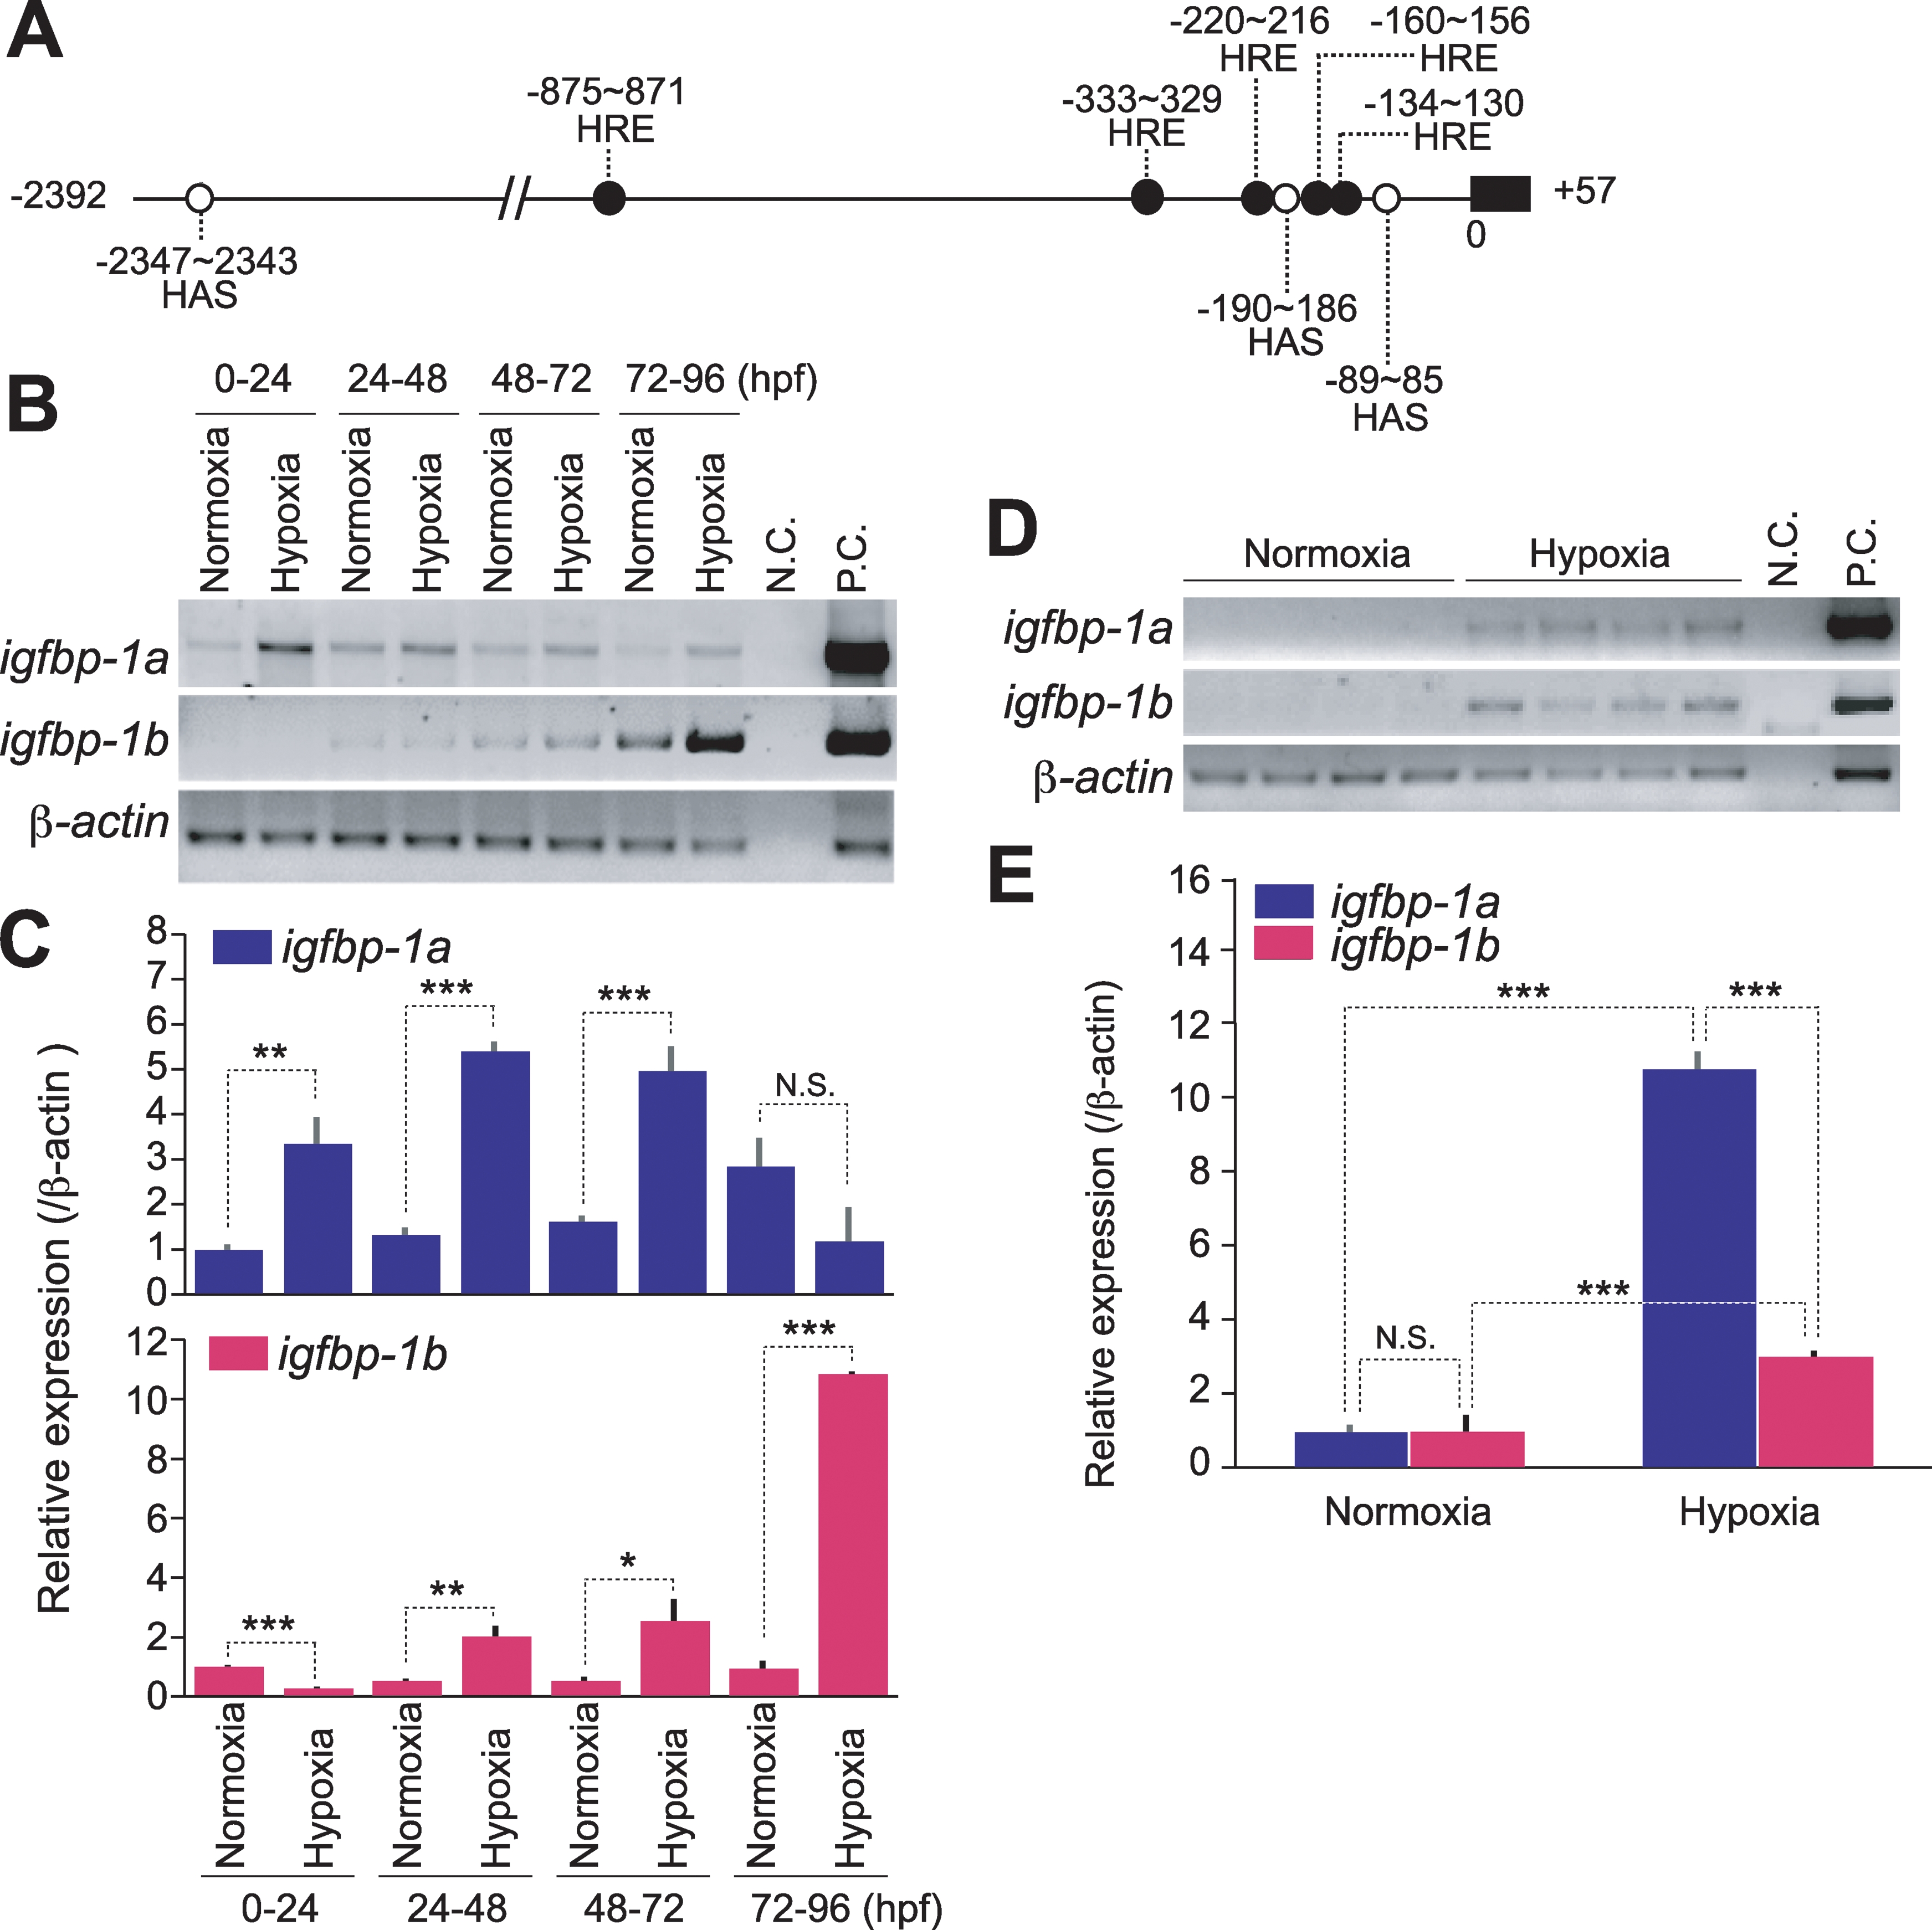
Fig. 4
The expression levels of igfbp-1a and igfbp-1b are differentially regulated by hypoxia.
A) Schematic diagram of the 5′-flanking region of igfbp-1b. 2,347 bp before the start codon are shown. 5 hypoxia response elements (HRE: ●) and 3 hypoxia inducible factor-1 (HIF-1) ancillary sequences (HAS: ○) are found in this region. B,C) Effects of hypoxia in developing zebrafish embryos. 0, 24, 48, and 72 hpf embryos were subjected to 24 h hypoxia as described in Materials and Methods. Total RNA was isolated and subjected to RT-PCR and qRT-PCR analysis. Representative RT-PCR results are shown in the upper panel B). IGFBP-1a and -1b mRNA levels were further analyzed by qRT-PCR and are expressed as relative value to those of the normoxia groups C). Data shown are means±S.E. of three independent experiments. *p<0.05, **p<0.01 compared to the normoxia group at the same time point. D, E) Hypoxia increases IGFBP-1a and -1b mRNA levels in adult fish. Total RNA was isolated from individual zebrafish that were kept in normaxia or intermediate hypoxia for 6 h. Representative RT-PCR results are shown in the upper panel D). qRT-PCR data are expressed as relative values to those of the normoxia group and shown in the lower panel E). Data shown are means±S.E. of three independent experiments. *p<0.05, **p<0.01 compared to each group.