
|
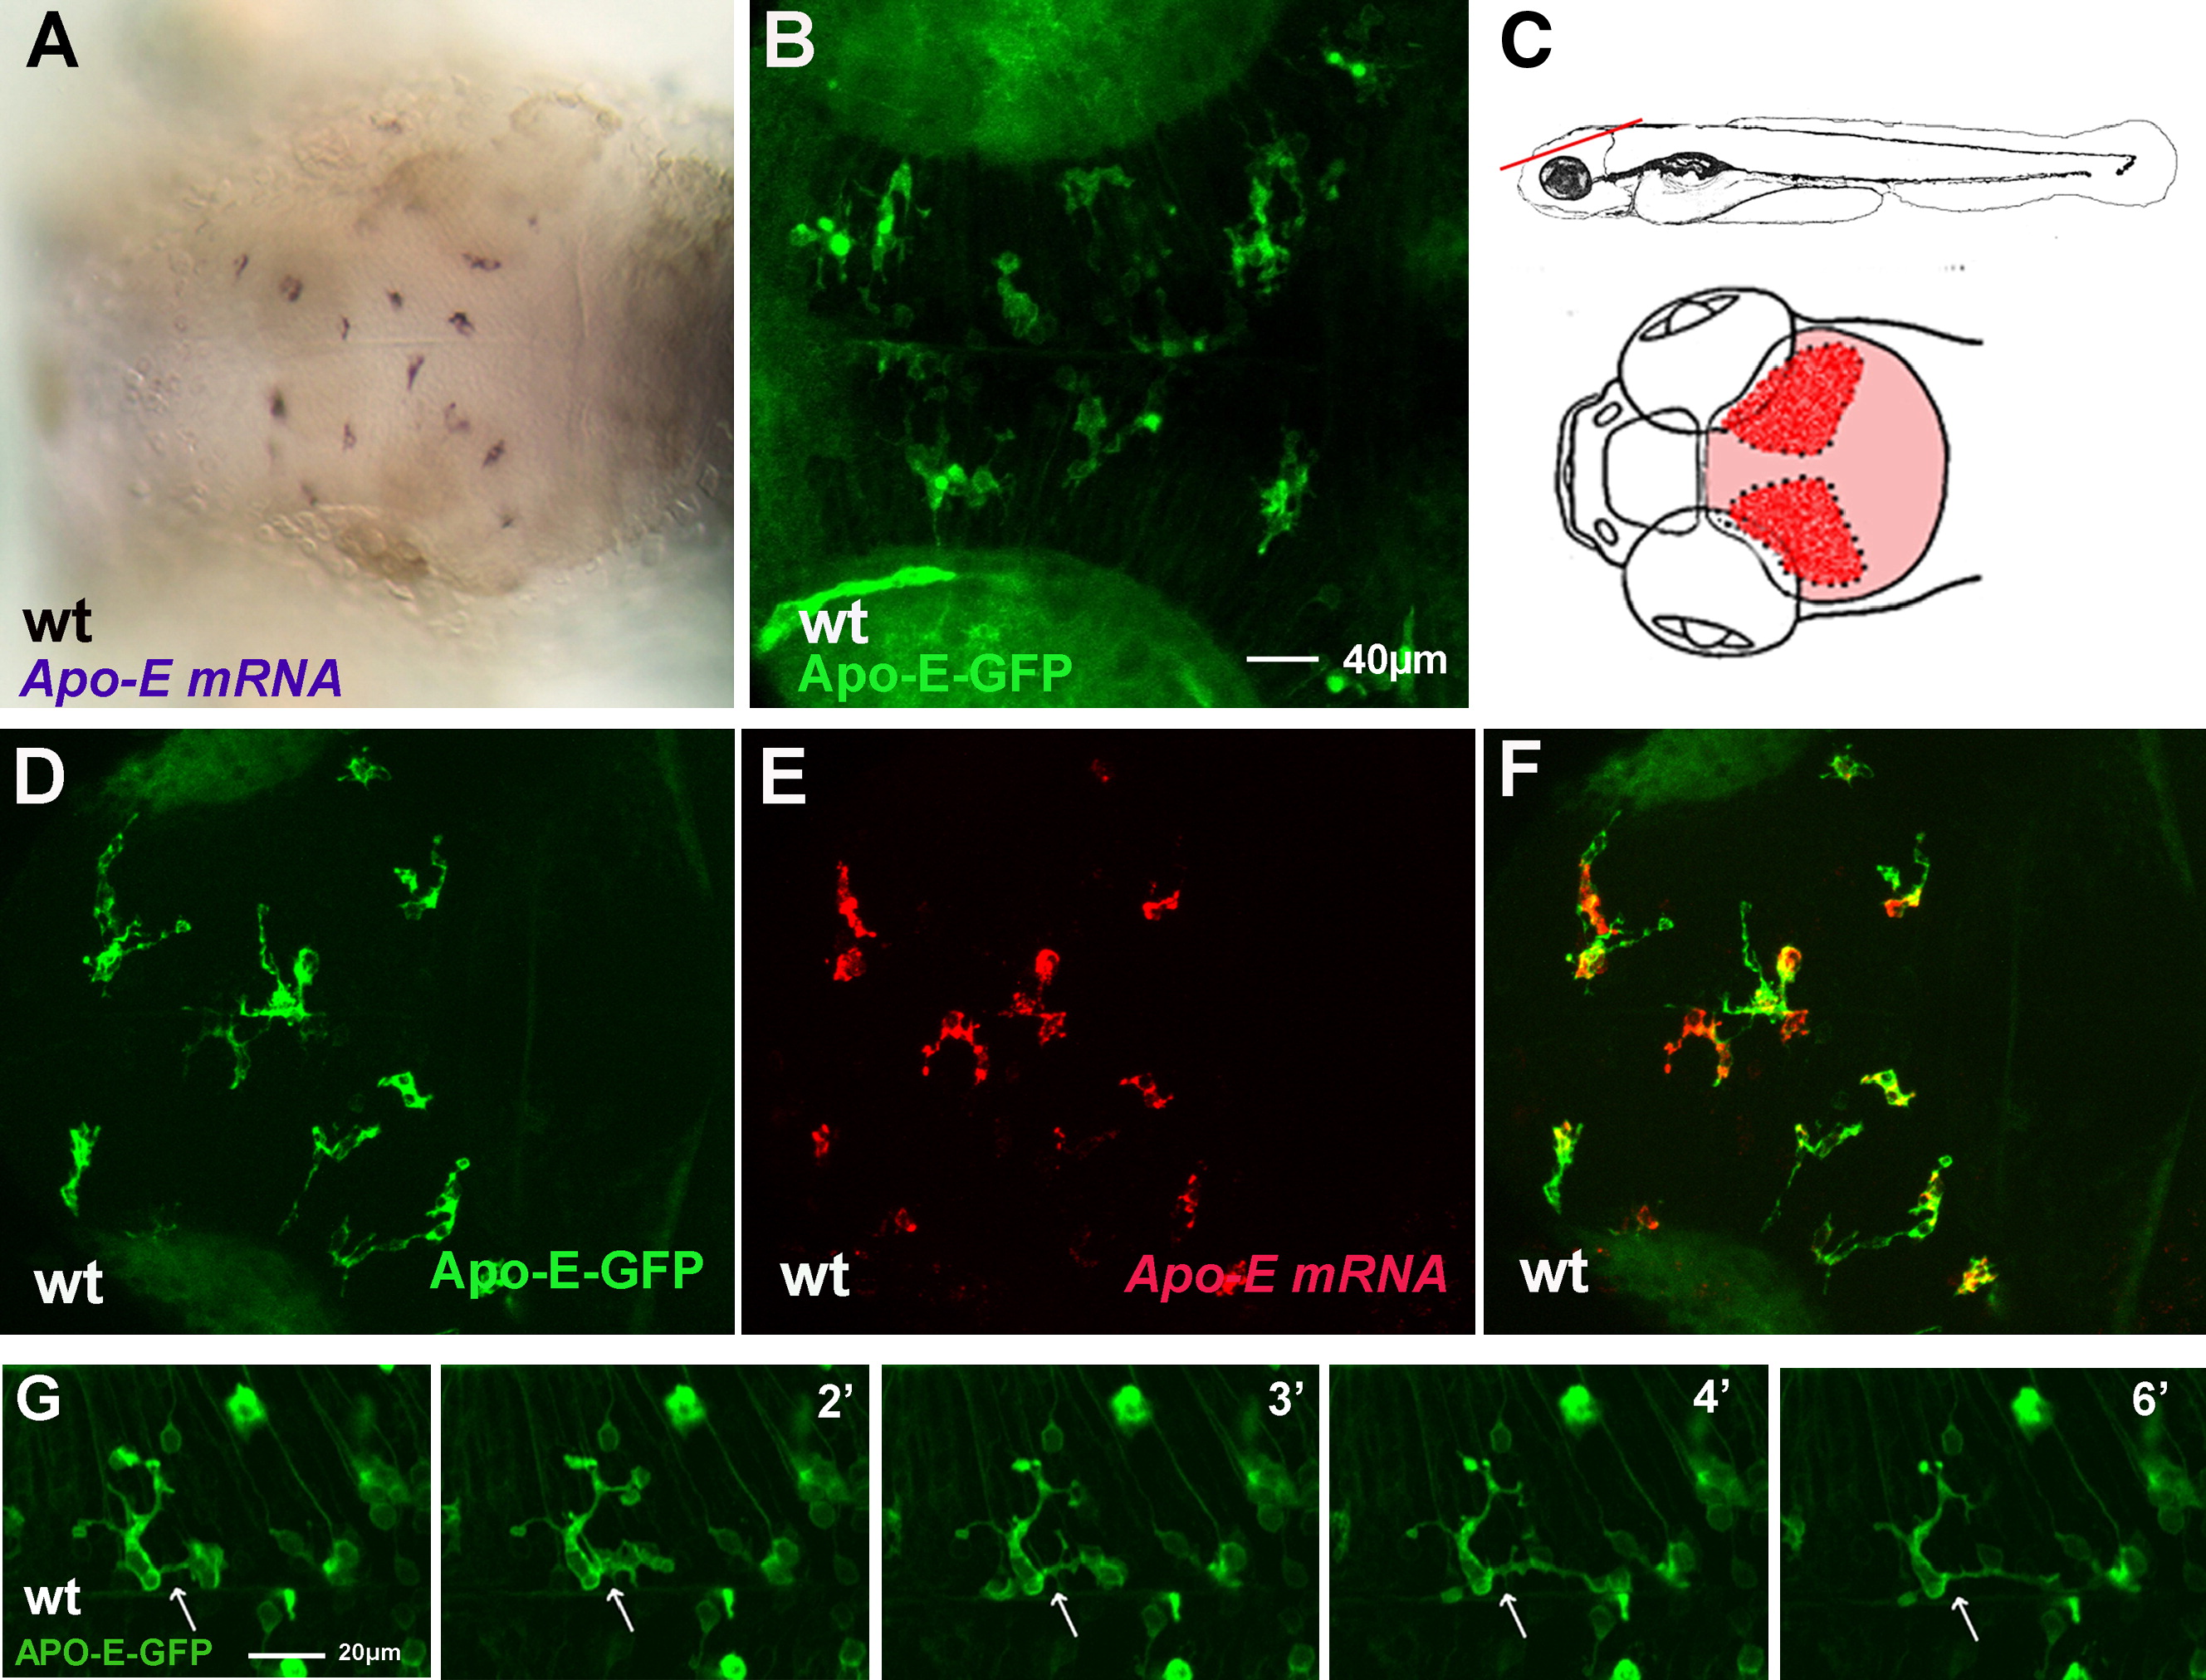
Fig. 1 Microglia in the Zebrafish Brain
(A and B) Dorsal views of a 3 dpf (days post fertilization) embryonic wild-type brain. (A) Microglial expression of the Apo-E mRNA. (B) GFP expression under the control of the Apo-E locus.
(C) Schematic drawings of the regions of interest. Anterior is to the left. The upper panel represents a side view of a 3 dpf fish. The red bar marks the region and the depth at which confocal imaging has been performed. The lower part represents a dorsal view of the examined area (light red). The optic lobes are marked in dark red.
(D–F) Dorsal view of a 3 dpf wild-type embryonic brain. Double antibody (green [D]) and in situ (red [E]) staining show a perfect overlap between GFP and apo-E expression (F).
(G) Confocal time-lapse of one branching Apo-E wild-type microglial cell. Time is indicated in minutes.
Reprinted from Cell, 133(5), Peri, F., and Nüsslein-Volhard, C., Live Imaging of Neuronal Degradation by Microglia Reveals a Role for v0-ATPase a1 in Phagosomal Fusion In Vivo, 916-927, Copyright (2008) with permission from Elsevier. Full text @ Cell