
|
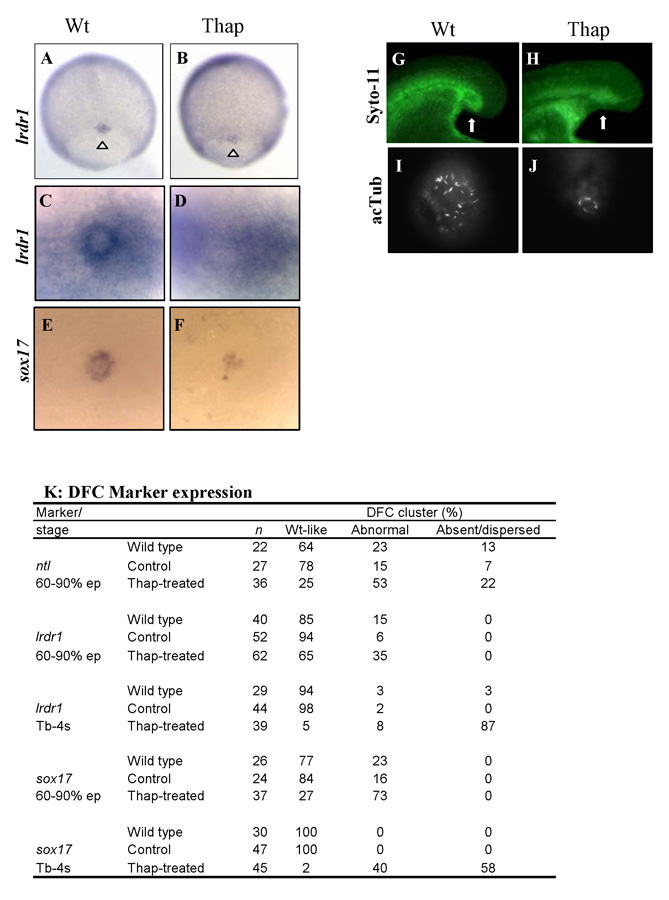
Fig. S4 Molecular marker evaluation of DFC migration/cohesion and Syto-11 uptake after thapsigargin treatment. Arrowheads denote lrdr1 expression 80% epiboly in the DFC region in (A) wt and (B) thapsigargin-treated embryos. lrdr1 expression at 4-somite stage in the KV region in (C) wt and in (D) thapsigargin-treated embryos. sox17 expression at 4-somite stage in the KV region in (E) wt and in (F) thapsigargin-treated embryos. Syto-11 fluorescence at 17-somite stage in the tail bud region in (G) wt and in (H) thapsigargin-treated embryos. Acetylated tubulin (acTub) immunostaining denotes cilia at 10-somite stage in the KV region in (I) wt and in (J) thapsigargin-treated embryos. (K) Summary of DFC distribution. Thap, thapsigargin.