
|
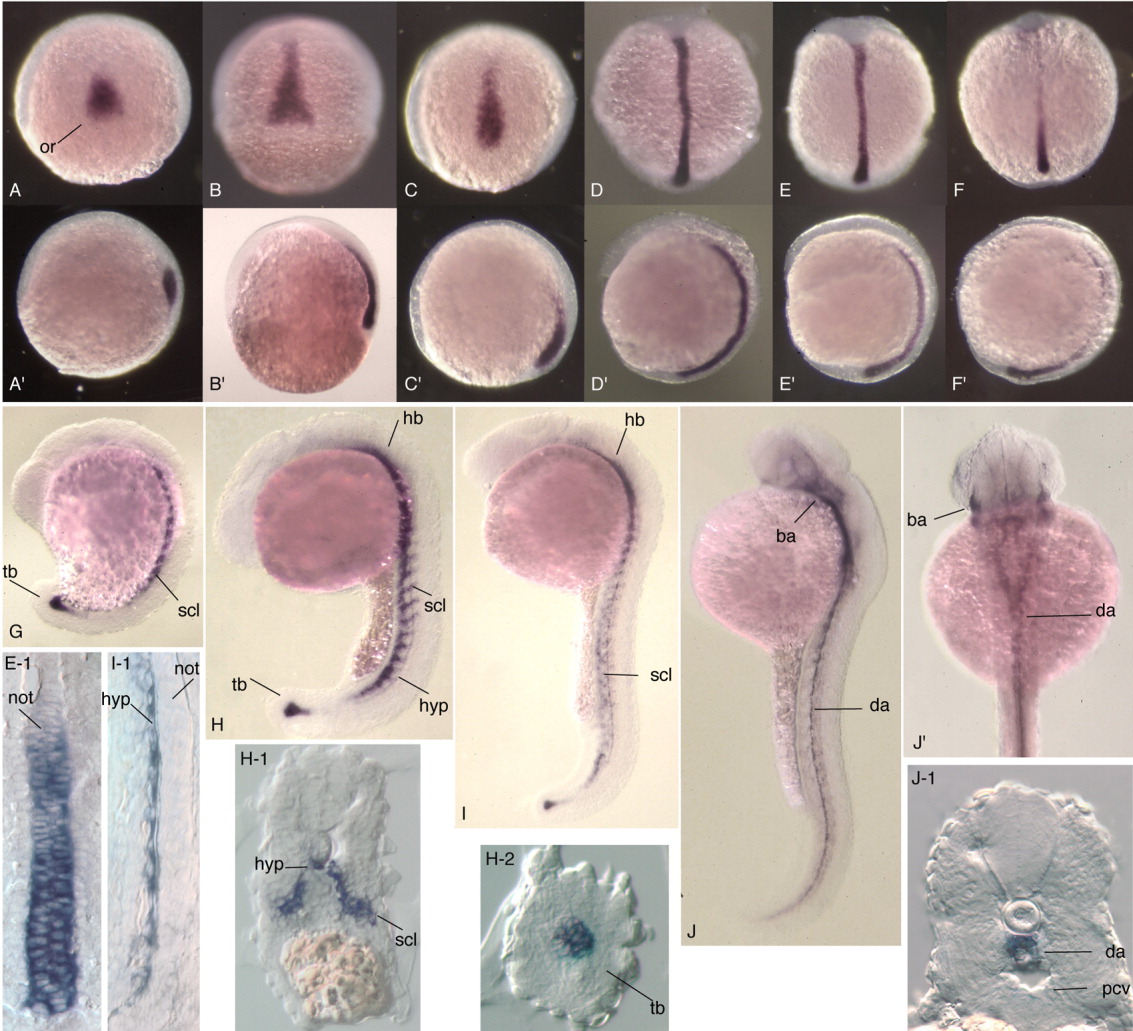
Fig. 5 Embryonic mRNA expression pattern of the zebrafish twist2 gene. All images labeled with the same letter represent the same embryo in different views. All images are oriented with rostral at the top; in all lateral views anterior is to the left. Embryos shown are at the following stages. A: ∼60% epiboly; B: ∼75% epiboly; C: ∼90% epiboly (10hpf); D: 1-2 somites; E: 3-4 somites; F: 10-11 somites; G: 14 somites; H: 24 somites; I: 24 hpf; J: 36hpf. A-F and J: Dorsal views; A′-F′, G-J: lateral views. N.B. Not shown is the start of twist2 expression as a weak signal at the earlier shield stage. ba, branchial and pharyngeal arches; da, dorsal aorta; fb, forebrain; hyp, hypochord; hb, hindbrain; not, notochord; or, organizer region; pcv, posterior cardinal vein; scl,sclerotome; tb, tail bud.