
|
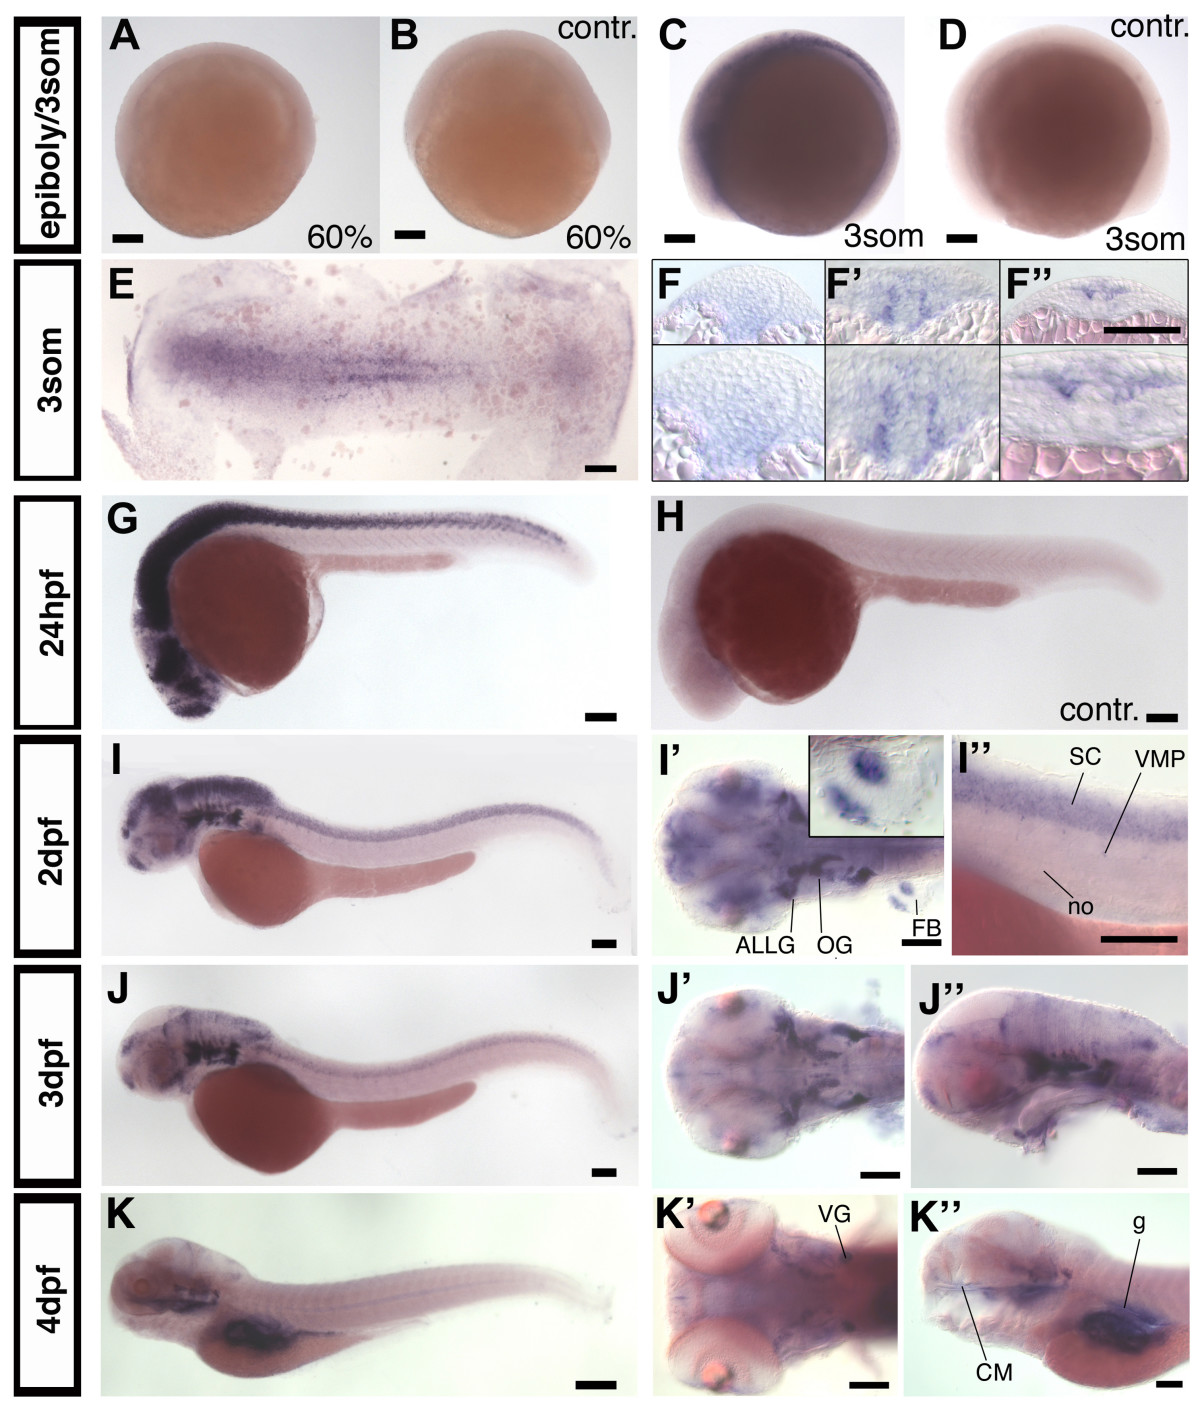
Fig. 2 nestin expression in zebrafish development. (A-D): nestin expression pattern during gastrula and early somitogenesis stages, (A) nestin is not expressed at 60% epibloy stage, (B) sense control. (C, D): First expression is detectable at 3 somite stage. (E, F-F″): Flat mount and cross sections of a 3 somite embryo. (G, sense control in H): Lateral view of 24 hpf embryo, nestin is expressed widely in CNS. (I, I′): 2 dpf, lateral view (I), dorsal view (I′) nestin is expressed in head ganglia and fin buds; insert in (I′) shows higher magnification of a fin bud; (I″) higher magnification of the spinal cord. nestin expression in the ventral root may correlate with glia or neuroblasts. (J-J″): At 3 dpf nestin expression becomes more restricted to proliferation zones, (J) lateral view, (J′, J″) higher magnifications, dorsal (J′) and lateral (J″) view. (K-K″): 4 dpf: nestin expression in the CNS is almost completely restricted to proliferation zones. Further expression is detected in the cranial ganglia, the gut and the craniofacial mesenchyme (K″). Abbreviations: ALLG: anterior lateral line ganglion; cm: craniofacial mesenchyme; FB: fin bud; g: gut; OG: octaval ganglion; no: notochord; SC: spinal cord; VG: vagal ganglion; VMP: ventral motoneuron precursors. (A-E, G-K″): anterior left, animal pole up, (F-F″): cross sections, dorsal up. Scale bars: 100 μm, except K: scale bar: 200 μm.