
|
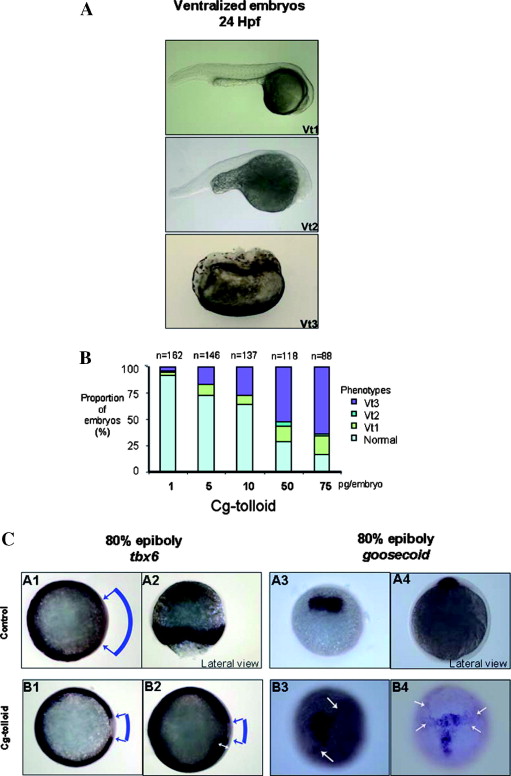
Fig. 3 The range of phenotypes observed on expression of Cg-tolloid in zebrafish embryos. (A) Examples showing ventralized phenotypes obtained after expression of Cg-tolloid. These phenotypes ranged from the least (Vt1) to the most severe (Vt3). (B) A histogram showing the phenotype distribution after expression of Cg-tolloid. The proportion of embryos showing an individual phenotype is indicated by colour. The number of embryos injected for each concentration of mRNA is indicated above each bar of the histograms. (C) In situ hybridization of zebrafish embryos using the ventrolateral mesoderm marker tbx6 and the dorsal mesoderm marker gsc at 80% epiboly. Two examples are shown for each group and each marker. Changes in the localization of the tbx6 expression pattern are highlighted. Arrows (B3 and 4) indicate an expansion of gsc expression towards the ventral region.
Reprinted from Gene expression patterns : GEP, 7(6), Herpin, A., Lelong, C., Becker, T., Favrel, P., and Cunningham, C., A tolloid homologue from the Pacific oyster Crassostrea gigas, 700-708, Copyright (2007) with permission from Elsevier. Full text @ Gene Expr. Patterns