
|
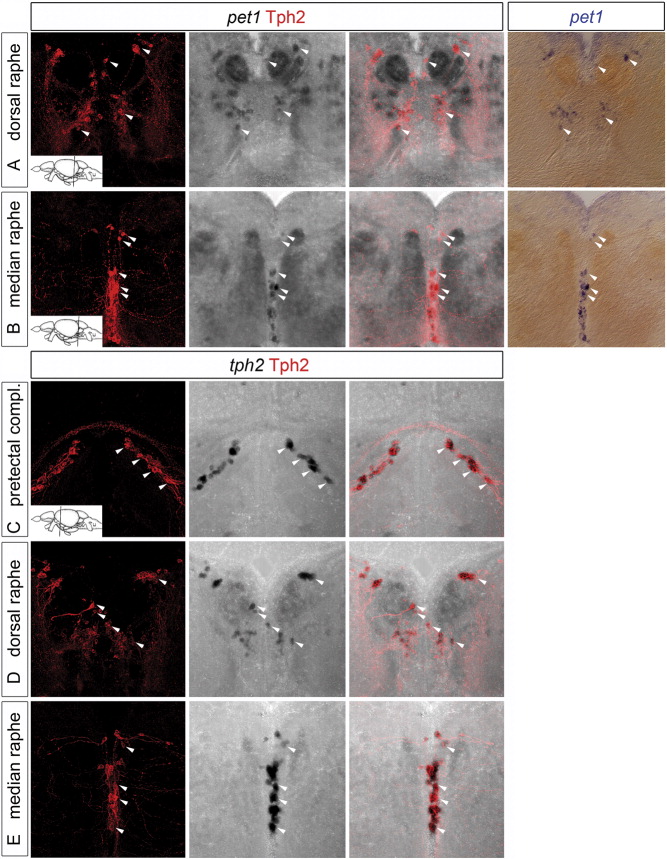
Fig. 4 Compared localization of pet1 and tph2 transcripts (in situ hybridization, black/blue) and of Tph2 protein (immunohistochemistry, red) on adult brain coronal sections. Arrowheads indicate examples of double-labeled cells. A,B:pet1 transcripts and Tph2 protein shown in optical projections of sections through the dorsal and the medial raphe, respectively, at the level indicated in the schematic pictures. Color brightfield pictures were included (right panels) to clarify the distinction between cross-cut fiber bundles (that appear dark on black-white images, but are negative for pet1 transcripts) and blue in situ staining. The dorsal raphe (corresponding to cluster B6-B7) is located more dorsally and laterally than the medial raphe (B8-B9; Kaslin and Panula,[2001]). C-E: The location of tph2 transcripts and Tph2 protein in the pretectal complex (level of section indicated in schematic picture) is illustrated (C) in addition to the dorsal (D) and median (E) raphe in optical projections. Schematic picture was modified from Wulliman et al. ([1996]).