
|
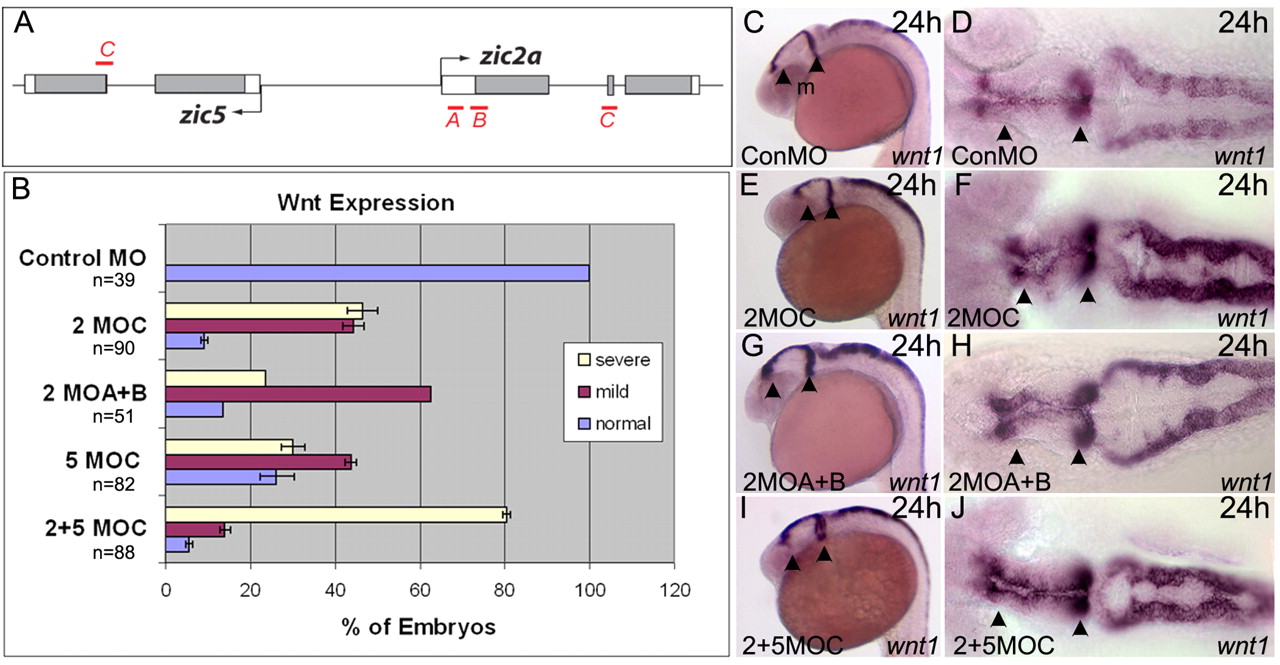
Fig. 7 MO knockdown of zic2a and zic5 disrupts dorsal midbrain formation. (A) MO-binding sites in the zic2a-zic5 locus. Coding regions are shown as gray boxes, non-coding transcribed regions as white boxes, and introns as lines. MO-binding sites are designated with red lines. (B-J) Embryos injected with indicated MOs were assayed for expression of wnt1 or wnt3a at 24-25 hpf. Error bars in B show s.e.m. (C,D) Embryo injected with conMO (8 ng) showing normal wnt1 expression. (E,F) Severely affected embryo injected with 2MOC (2 ng) showing disorganized wnt1 expression in dorsal midbrain and hindbrain. (G,H) Mildly affected embryo injected with 2MOA+2MOB (6.6 ng). (I,J) Embryos co-injected with 2MOC and 5MOC (1 ng each) showing severe defects in wnt1 expression. C,E,G,I are lateral views; D,F,H,J are dorsal views of the embryos shown to the left; embryos are positioned with anterior to the left. Arrowheads indicate the midbrain.