
Image
|
Figure Caption
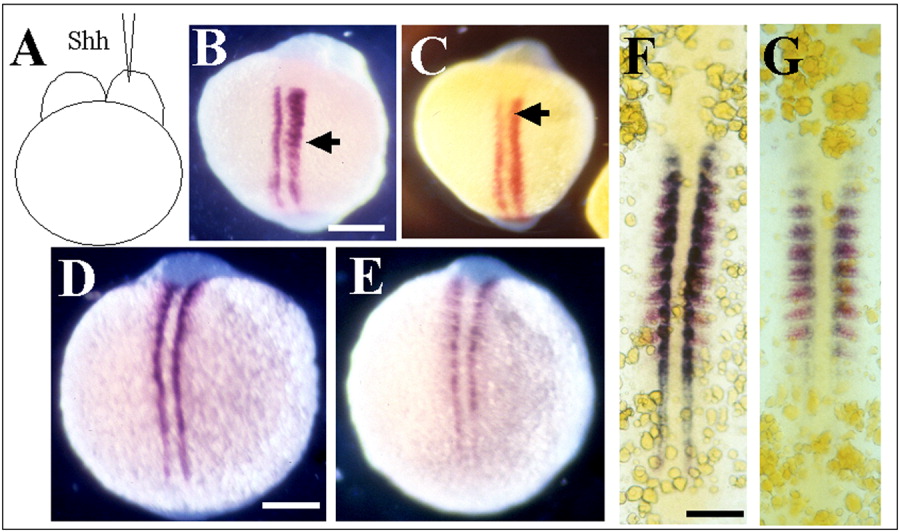
Fig. 6 Regulation of smyd1 gene expression in adaxial cells by Hedgehog signal. A-C: Microinjection of Shh mRNA induces smyd1 (B) or myod (C) expression in the injected side as indicated by arrows. D-G: Comparison of smyd1 expression in wild-type (D,F) and smo (E) or yot (G) mutant embryos. smyd1 expression is reduced in the mutant embryos. F and G are dual in situ with smyd1 (blue) and myod (red). Scale bars = 200 μm in A-C, 150 μm in D, 75 μm in E.
Figure Data
Acknowledgments
This image is the copyrighted work of the attributed author or publisher, and
ZFIN has permission only to display this image to its users.
Additional permissions should be obtained from the applicable author or publisher of the image.
Full text @ Dev. Dyn.