
Image
|
Figure Caption
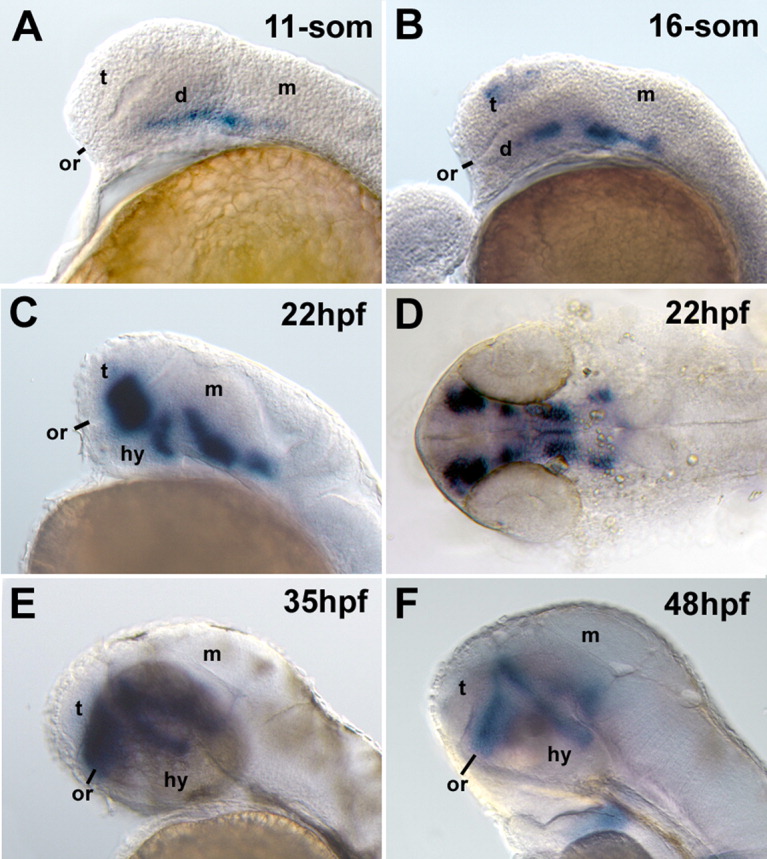
Fig. 2 Sim1 is expressed in specific and complex patterns in the embryonic brain. Sim1 mRNA expression was determined by in situ hybridization histochemistry (ISHH). A-C, E, F: Lateral views, dorsal is up and anterior to the left. D: Dorsal view, anterior to the left. The age of the embryos is indicated on each panel in somite (som) stage or hours post fertilization (hpf). The location of the optic recess (or) is indicated by a black bar. t, telencephalon; d, diencephalon; m, midbrain; hy, hypothalamus.
Figure Data
Acknowledgments
This image is the copyrighted work of the attributed author or publisher, and
ZFIN has permission only to display this image to its users.
Additional permissions should be obtained from the applicable author or publisher of the image.
Full text @ Dev. Dyn.