
|
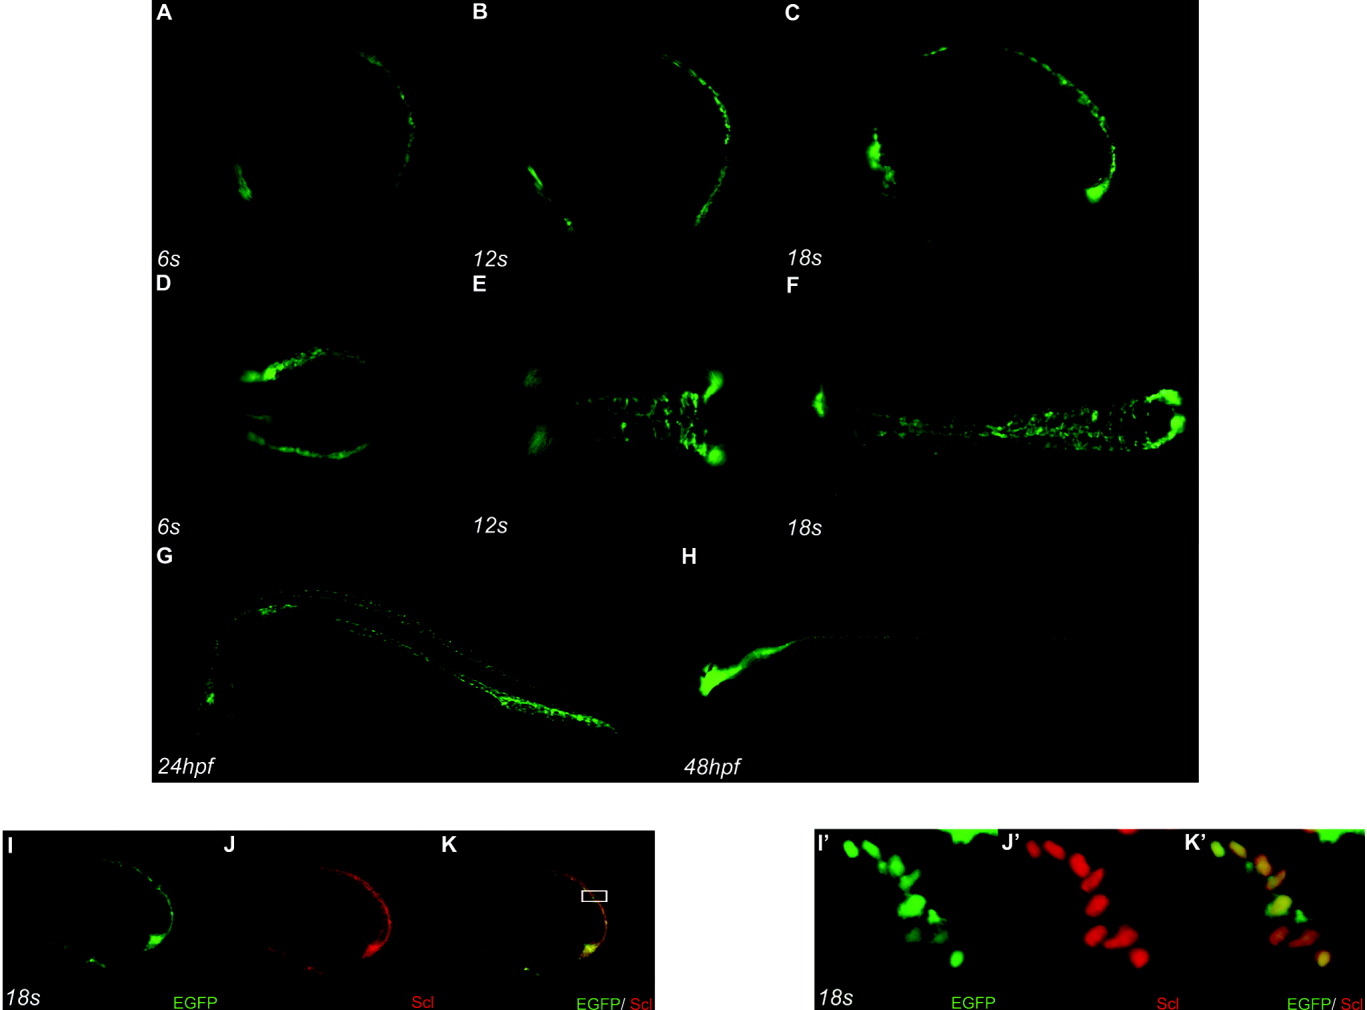
Fig. 2 The enhanced green fluorescence protein (EGFP) protein expression pattern in the Tg(5' 5kbscl:EGFP)a transgenic fish. A-H: Lateral (A-C,G,H) and dorsal (D-F) views of the 6-somite (6s), 12-somite (12s), 18-somite (18s), 24 hours postfertilization (hpf), and 48 hpf stage Tg(5' 5kbscl:EGFP)a embryos, respectively, show the EGFP protein expression in a manner similar to the endogenous Scl protein expression pattern. I,J: Lateral views of 18-somite stage (18s) Tg(5' 5kbscl:EGFP)a embryos immunohistochemistry stained with anti-EGFP (I, green) and anti-zebrafish Scl (J, red) antibodies. K: Superimposed view of I and J (original magnification, x10). I'-K' Confocal images (x100 magnification) of the boxed region in I, J, and K confirm the colocalization of the EGFP protein (green) with the endogenous Scl protein (red). In all the panels, embryos are oriented with anterior to the left.