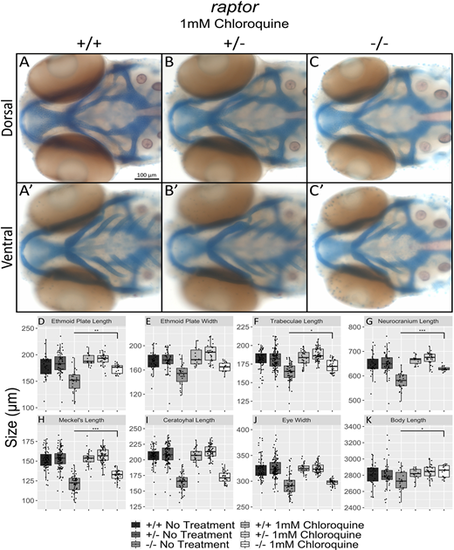
Craniofacial and body phenotypes in raptor mutants are partially rescued by chemical inhibition of autophagy. (A-C′) Dorsal and ventral view of (A,A′) wild-type, (B,B′) heterozygous and (C,C′) mutant fish exposed to 1 mM chloroquine from 6 hpf to 4 dpf. Anterior is towards the left. (D-K) Quantification of measurements of (D-I) craniofacial elements, (J) eyes and (K) body length. From left to right for each graph, the genotypes and treatments are: raptor +/+ no treatment, +/− no treatment, −/− no treatment, +/+ 1 mM chloroquine, +/− 1 mM chloroquine and −/− 1 mM chloroquine. The statistical analyses were conducted using one-way ANOVA followed by Tukey's honest significant difference (HSD) post-hoc test for multiple comparisons, *P<0.05, **P<0.01, ***P<0.001. The top and bottom of each box correspond to the third quartile (Q3) and first quartile (Q1), respectively. Each box covers the interquartile range (IQR), where 50% of the data lies. The median is depicted by the horizontal line within each box. The upper whisker extends to the largest value within Q3 + 1.5 * IQR. The lower whisker extends to the smallest value within Q1 - 1.5 * IQR. Any data point outside these whiskers is classified as an outlier. See Mcgill et al. (1978).
|
