FIGURE

Fig. 2

ID
ZDB-FIG-240419-100
Publication
Morizet et al., 2024 - Reconstruction of macroglia and adult neurogenesis evolution through cross-species single-cell transcriptomic analyses
Other Figures
All Figure Page
Back to All Figure Page
Fig. 2

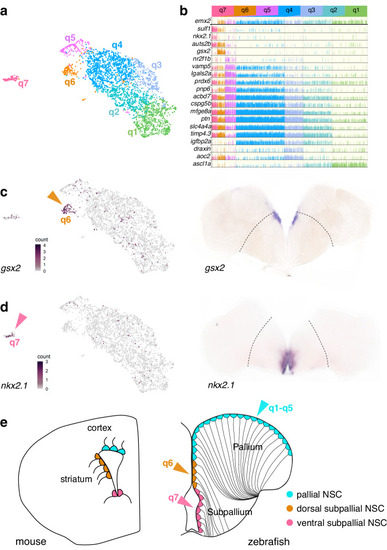
qRG in the zebrafish adult telencephalon are spatially patterned.

a UMAP of qRG (green cluster from Fig. 1b) colored by terminal cluster identity. b Expression of marker genes across qRG clusters, highlighting cluster-specific, regional and quiescence markers. c, d Orthologs of ganglionic eminences markers (gsx2, nkx2.1) projected on zebrafish UMAP (left, color-coded arrows matching (a) and (b)) and with ISH on coronal slices of the adult zebrafish telencephalon (right). Dashed lines indicate the boundary between pallium and subpallium. e, Homologies of ventricular territories between zebrafish and mouse telencephalon (coronal sections) inferred from expression of regionalized transcription factor genes such as emx2, gsx2 and nkx2.110,94,95. Depicted cells are RG, colored by their developmental origin (color-coded relative to clusters).

Expression Data

Expression Detail
Antibody Labeling
Phenotype Data

Phenotype Detail
Acknowledgments
This image is the copyrighted work of the attributed author or publisher, and ZFIN has permission only to display this image to its users. Additional permissions should be obtained from the applicable author or publisher of the image. Full text @ Nat. Commun.