
FIGURE
Fig. 4
Fig. 4
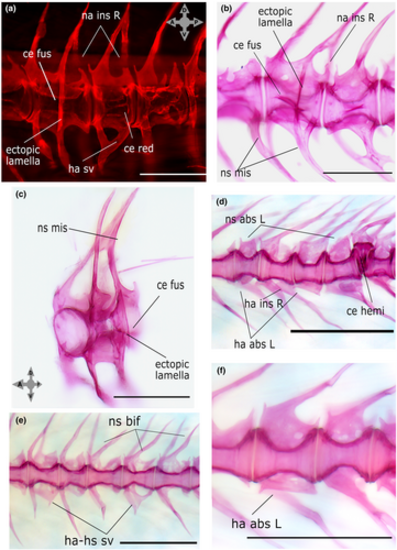
Fluorescent (a) and bright-field (b–f) images of whole-mount stained specimens. Refer to Table 1 for the variation codes. Scale bars = 500 μm. The four-headed arrow in panel (a) indicates sample orientation in (a), (b) and (d–f). |
Expression Data
Expression Detail
Antibody Labeling
Phenotype Data
Phenotype Detail
Acknowledgments
This image is the copyrighted work of the attributed author or publisher, and
ZFIN has permission only to display this image to its users.
Additional permissions should be obtained from the applicable author or publisher of the image.
Full text @ J. Anat.