
Fig. 1
- ID
- ZDB-FIG-240125-51
- Publication
- Ross et al., 2023 - Evolutionary conservation of embryonic DNA methylome remodelling in distantly related teleost species
- Other Figures
- All Figure Page
- Back to All Figure Page
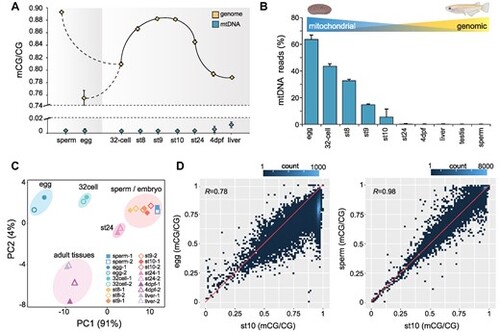
Global DNA methylation levels during medaka embryo development. (A) Global genomic and mitochondrial DNA methylation levels (mCG/CG) in developing medaka embryos. Each point represents the mean of two WGBS biological replicates with error bars indicating the standard error. Stages correspond to: sperm, egg, 32-cell, stage 8 early morula (st.8), stage 9 late morula (st.9), stage 10 early blastula (st.10), stage 11 late blastula (st.11), stage 24—16 somite (st.24) and 4 days post-fertilisation (4dpf). Y-axis is split into 0–0.02 and 0.74–0.9 ranges. (B) Percentage of mitochondrial reads in WGBS datasets. Each point represents the mean of two WGBS replicates with error bars indicating the standard error. (C) Principal component analysis (PCA) of WGBS methylomes corresponding to developing medaka embryos (10kb non-overlapping genomic bins). (D) Correlation between mCG/CG (10kb non-overlapping genomic bins) in st.10 embryos (zygotic genome activation – ZGA), sperm (left) and egg (right). r indicates Pearson correlation values. |