|
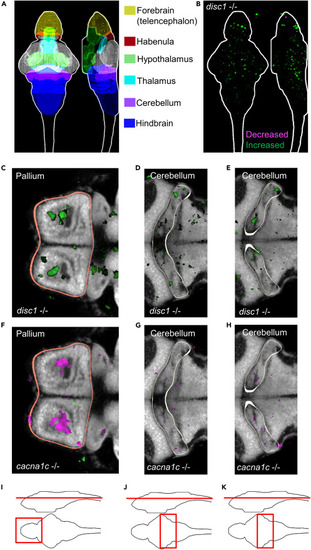
Brain-wide mapping of neural activity in disc1 mutants following acoustic stimulus (A) Color coded diagram highlighting several structures in the larval zebrafish brain at 7 dpf. (B) Sum-of-slices projections (x- and z-axes) of significant differences between disc1 mutant and sibling control groups (n = 44 HOM and n = 38 sibling controls). Increased versus decreased neuronal activity in disc1 mutants is displayed as green and magenta, respectively. (C-H) Image slices showing the specific brain subregions with significant differences in neuronal activity in (C-E) disc1 and (F-H) cacna1c mutants. Images of activity in the (C,F) pallium (outlined in orange) and (D-E), (G-H) cerebellum (outlined in white) demonstrating increased activity differences in these regions in disc1 mutants and decreased activity differences in these regions in cacna1c mutants. (I-K) Diagrams indicating the spatial location of the image slices displayed in panels C/F, D/G, and E/H, respectively.
|