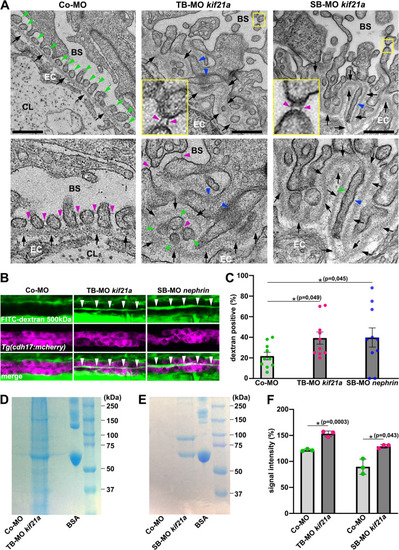
Kif21a deficiency results in defective podocyte morphology leading in a leaky glomerular filtration barrier and proteinuria. (A) Representative electron micrographs of glomerular region from 5dpf old zebrafish embryos injected with Co-MO (6 ng), TB-MO kif21a (1 ng) or SB-MO kif21a (6 ng). Green, blue and magenta arrowheads point to podocyte foot processes, podocyte foot process effacements and slit diaphragms, respectively. Black arrows point to glomerular basement membrane. Yellow-framed boxes represent magnifications of respective insets. Bowman’s space (BS), capillary lumen (CL), fenestrated endothelial cell (EC). Scale bars represent 500 nm. (B) Representative confocal images of 4dpf old Tg(cdh17:mcherry) embryos (expressing red fluorescent reporter protein in the pronephric tubules) injected with Co-MO (2 ng), TB-MO kif21a (1 ng) or SB-MO nephrin (2 ng) that were injected with 500 kDa FITC-dextran into the common cardinal vein at 80hpf. White arrowheads indicate the presence of 500 kDa FITC-dextran in the pronephric tubule lumen. (C) Quantification of 4dpf old embryos injected with Co-MO (2 ng), TB-MO kif21a (1 ng) or SB-MO nephrin (2 ng) that show the presence of 500 kDa FITC-dextran in their pronephric tubule lumen. The knockdown of nephrin, a well-established zebrafish model causing dysfunction of the GFB and proteinuria, served as positive control. The barchart represents the pooled data from 10 independent experiments for each condition; number (n) of total embryos analysed: Co-MO, n = 98; TB-MO kif21a, n = 100; SB-MO nephrin, n = 92). (D) SDS-PAGE analysis of processed urine samples of embryos injected with Co-MO (2 ng) or TB-MO kif21a (2 ng) for the identification of proteinuria. Bovine serum albumin (BSA) was used as positive control. (E) SDS-PAGE analysis of processed urine samples of embryos injected with Co-MO (6 ng) or SB-MO kif21a (6 ng) for the identification of proteinuria. BSA was used as positive control. (F) Quantification of SDS-PAGE signal intensity of embryos injected with Co-MO (2 or 6 ng), TB-MO kif21a (2 ng) or SB-MO kif21a (6 ng). The barchart represents the pooled data from 3 independent experiments for each condition. Unprocessed SDS-PAGE images (D and E) are presented in Supplementary Fig. S4.
|
