|
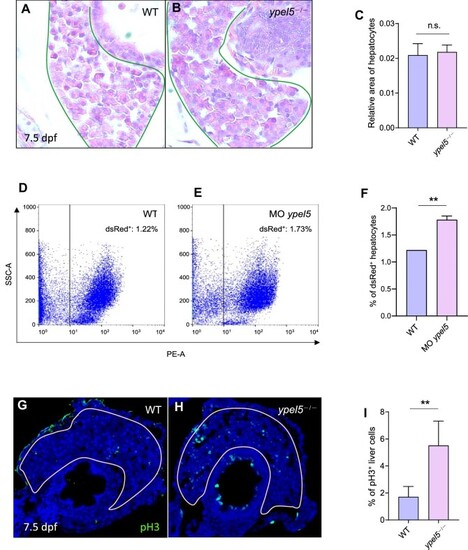
ypel5 deficiency results in enhanced hepatic cell proliferation. (A–C) Representative images of H&E staining (A and B) and relative hepatocyte size (C) of WT and ypel5−/− mutant zebrafish at 7.5 dpf. The livers are outlined with green lines. (D–F) FACS analysis (D and E) and quantification (F) of dsRed-positive hepatocytes from WT and Tg(fabp10a:dsRed) larvae at 7.5 dpf. (G–I) Representative images of pH3 staining (green) to label hepatic cell proliferation (G and H) and quantification of pH3-positive liver cells (I) in WT and ypel5−/− mutant zebrafish at 7.5 dpf. The sections were counterstained with DAPI to label the nucleus (blue). White lines circle the boundary of the liver. Data shown are mean ± SEM. Student's t-test. n.s., not significant; **P < 0.01.
|