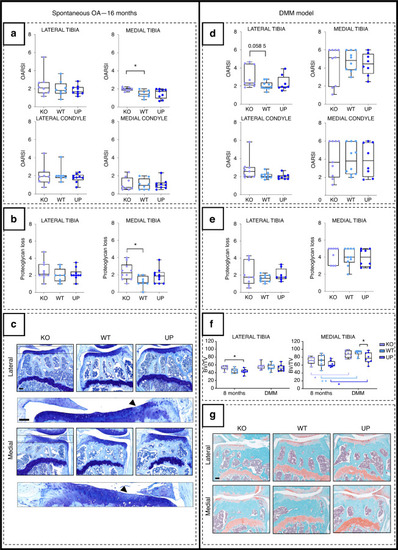
Analysis of the development of OA lesions in the different genotypes after spontaneously occurring with age (left) or after the DMM (right). The spontaneous OA lesions were considered in the 16-month-old male mice and the DMM was performed on 16-week-old male mice and they were stopped at 28 weeks. a, d The cartilage degradation was assessed with the OARSI score (from 0 to 6) according to the OARSI recommendations. The score was attributed to the lateral and the medial tibial plateaus and to the lateral and medial condyles for the spontaneous model and the DMM model. b, e The score of the loss of proteoglycan (from 0 to 5) was assessed according to the OARSI recommendations for the lateral and medial tibial plateaus for the spontaneous model and the DMM model. For the OARSI score of the 16-month-old mice: n = 8 for the KO and the WT and n = 9 for the UP and for the loss of proteoglycan n = 10 for the KO, n = 8 for the WT and n = 10 for the UP. For the DMM model: n = 9 for the KO, n = 10 for the WT, and n = 8 for the UP. One-way ANOVA was performed with differences being considered significant at P values <0.05 (*P < 0.05). c Illustrations of the lateral and medial plateaus stained with Toluidine blue of the 16-month-old mice with zooms on proteoglycan loss issued from the KO and indicated by the arrowhead. Scale bar = 100 µm. f Histomorphometry of the subchondral bone on Safranin-O Fast Green of the knee joint of the DMM mice was performed with QuPath on the medial and lateral plateaus separately. Each genotype was compared to a similar age group of 8-month-old mice. At 8 months: n = 8 for each genotype; for the DMM: n = 9 for the KO, n = 10 for the WT, and n = 8 for the UP. The data were plotted as a box plot showing all points. Two-way ANOVA was performed with differences being considered significant at P values <0.05 (*P < 0.05, **P ≤ 0.01). g Illustrations of the lateral and medial plateaus stained with Safranin-O Fast Green in the DMM. Scale bar = 100 µm
|
