|
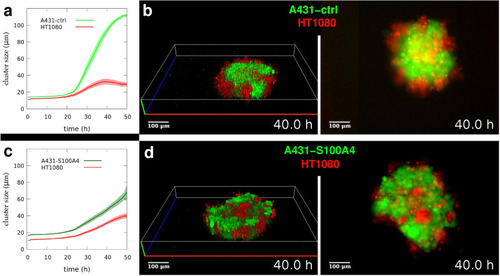
Spatial positioning during segregation depends on non-muscle myosin 2 assembly and function. a Time-dependent growth of segregated cell domains in mixed suspensions of A431 keratinocytes overexpressing inactive mutant S100A4 (A431-ctrl) and HT1080 fibrosarcoma cells (n = 6). b Representative 3D reconstruction (left panel) and simultaneous epifluorescent (right panel, bottom view) images from time-lapse videos of segregating clusters of A431-ctrl (green) and HT1080 (red) cells after 40 h of segregation, see Supplementary Movie 10. c Time-dependent growth of segregated domains in mixtures of A431 keratinocytes overexpressing NM2 assembly inhibitor S100A4 (A431-S100A4) and HT1080 fibrosarcoma cells (n = 6). d Representative 3D reconstruction (left panel) and epifluorescent (right panel, bottom view) images of segregating clusters of A431-S100A4 (green) and HT1080 (red) cells after 40 h of segregation, see Supplementary Movie 11. Note the inverted configuration of segregated domains here, compared to (b). Scale bar: 100 µm in (b, d). Error stripes represent SEM in (a, c). See also Supplementary Fig. 4.
|